- Table of Contents
- Intro
- When It Matters
- Our Tests
- Additional Information
- Works Cited
- Comments
- 50.0% WHD @ 94 dB SPL
- 50.0% WHD @ 104 dB SPL
Total harmonic distortion is a measurement of artifacts produced in audio reproduction when frequencies that weren't intended are generated.
That said, it's very difficult to hear unless you're an astute audiophile. Most reputable headphones won't exhibit audible levels of distortion that could impact your listening enjoyment, either. Distortion shouldn't be a critical part of your buying decision, but if you're curious about all the fine details and why we still measure it, keep reading.
Given distortion is any change to the original signal by a system, harmonic distortion is a series of unintended generated frequencies, called harmonics, that are integer multiples of the input frequency. It's also worth noting that distortion differs from noise by being dependent/related to the original signal, whereas noise is a random external/unrelated signal added to the original signal. In sound reproduction, harmonic distortion is considered a flaw since it indicates the presence of frequencies that weren't included in the original content. This colors the sound and could make the music sound impure, harsh, or muddy.
We perform harmonic distortion tests at 94 dBSPL and at 104 dBSPL. From these results, we calculate the headphones' weighted total harmonic distortion (weighted THD) for the mentioned sound pressure levels.
Test results
When It Matters
It's important to have headphones that produce low amounts of harmonic distortion if you're looking for clean and pure sound reproduction. An example of this is for audio mastering applications or critical listening, especially when there's a preference for a clean and uncolored reproduction, like in classical music.
However, since moderate—and even in some cases—high amounts of harmonic distortion aren't very audible to humans, most headphones can be considered good enough in this regard. Except for extreme cases, when headphones use extremely cheap components or lack quality control, their harmonic distortion performance shouldn't be a deciding factor. Audible levels of harmonic distortion tend to deteriorate the sound reproduction by making it muddy, colored, or harsh, especially at higher volumes, since harmonic distortion tends to rise as the volume is increased.
Our Tests
The test signal for our THD measurements is the same as our frequency response test signal. As part of our Acoustic Response Pass, we use a logarithmic chirp swept between 20Hz and 20kHz. We place the headphones on our B&K 5128, which is connected to our Audio Precision AP517b Analyzer. The analyzer features a built-in headphone amp and Bluetooth module.
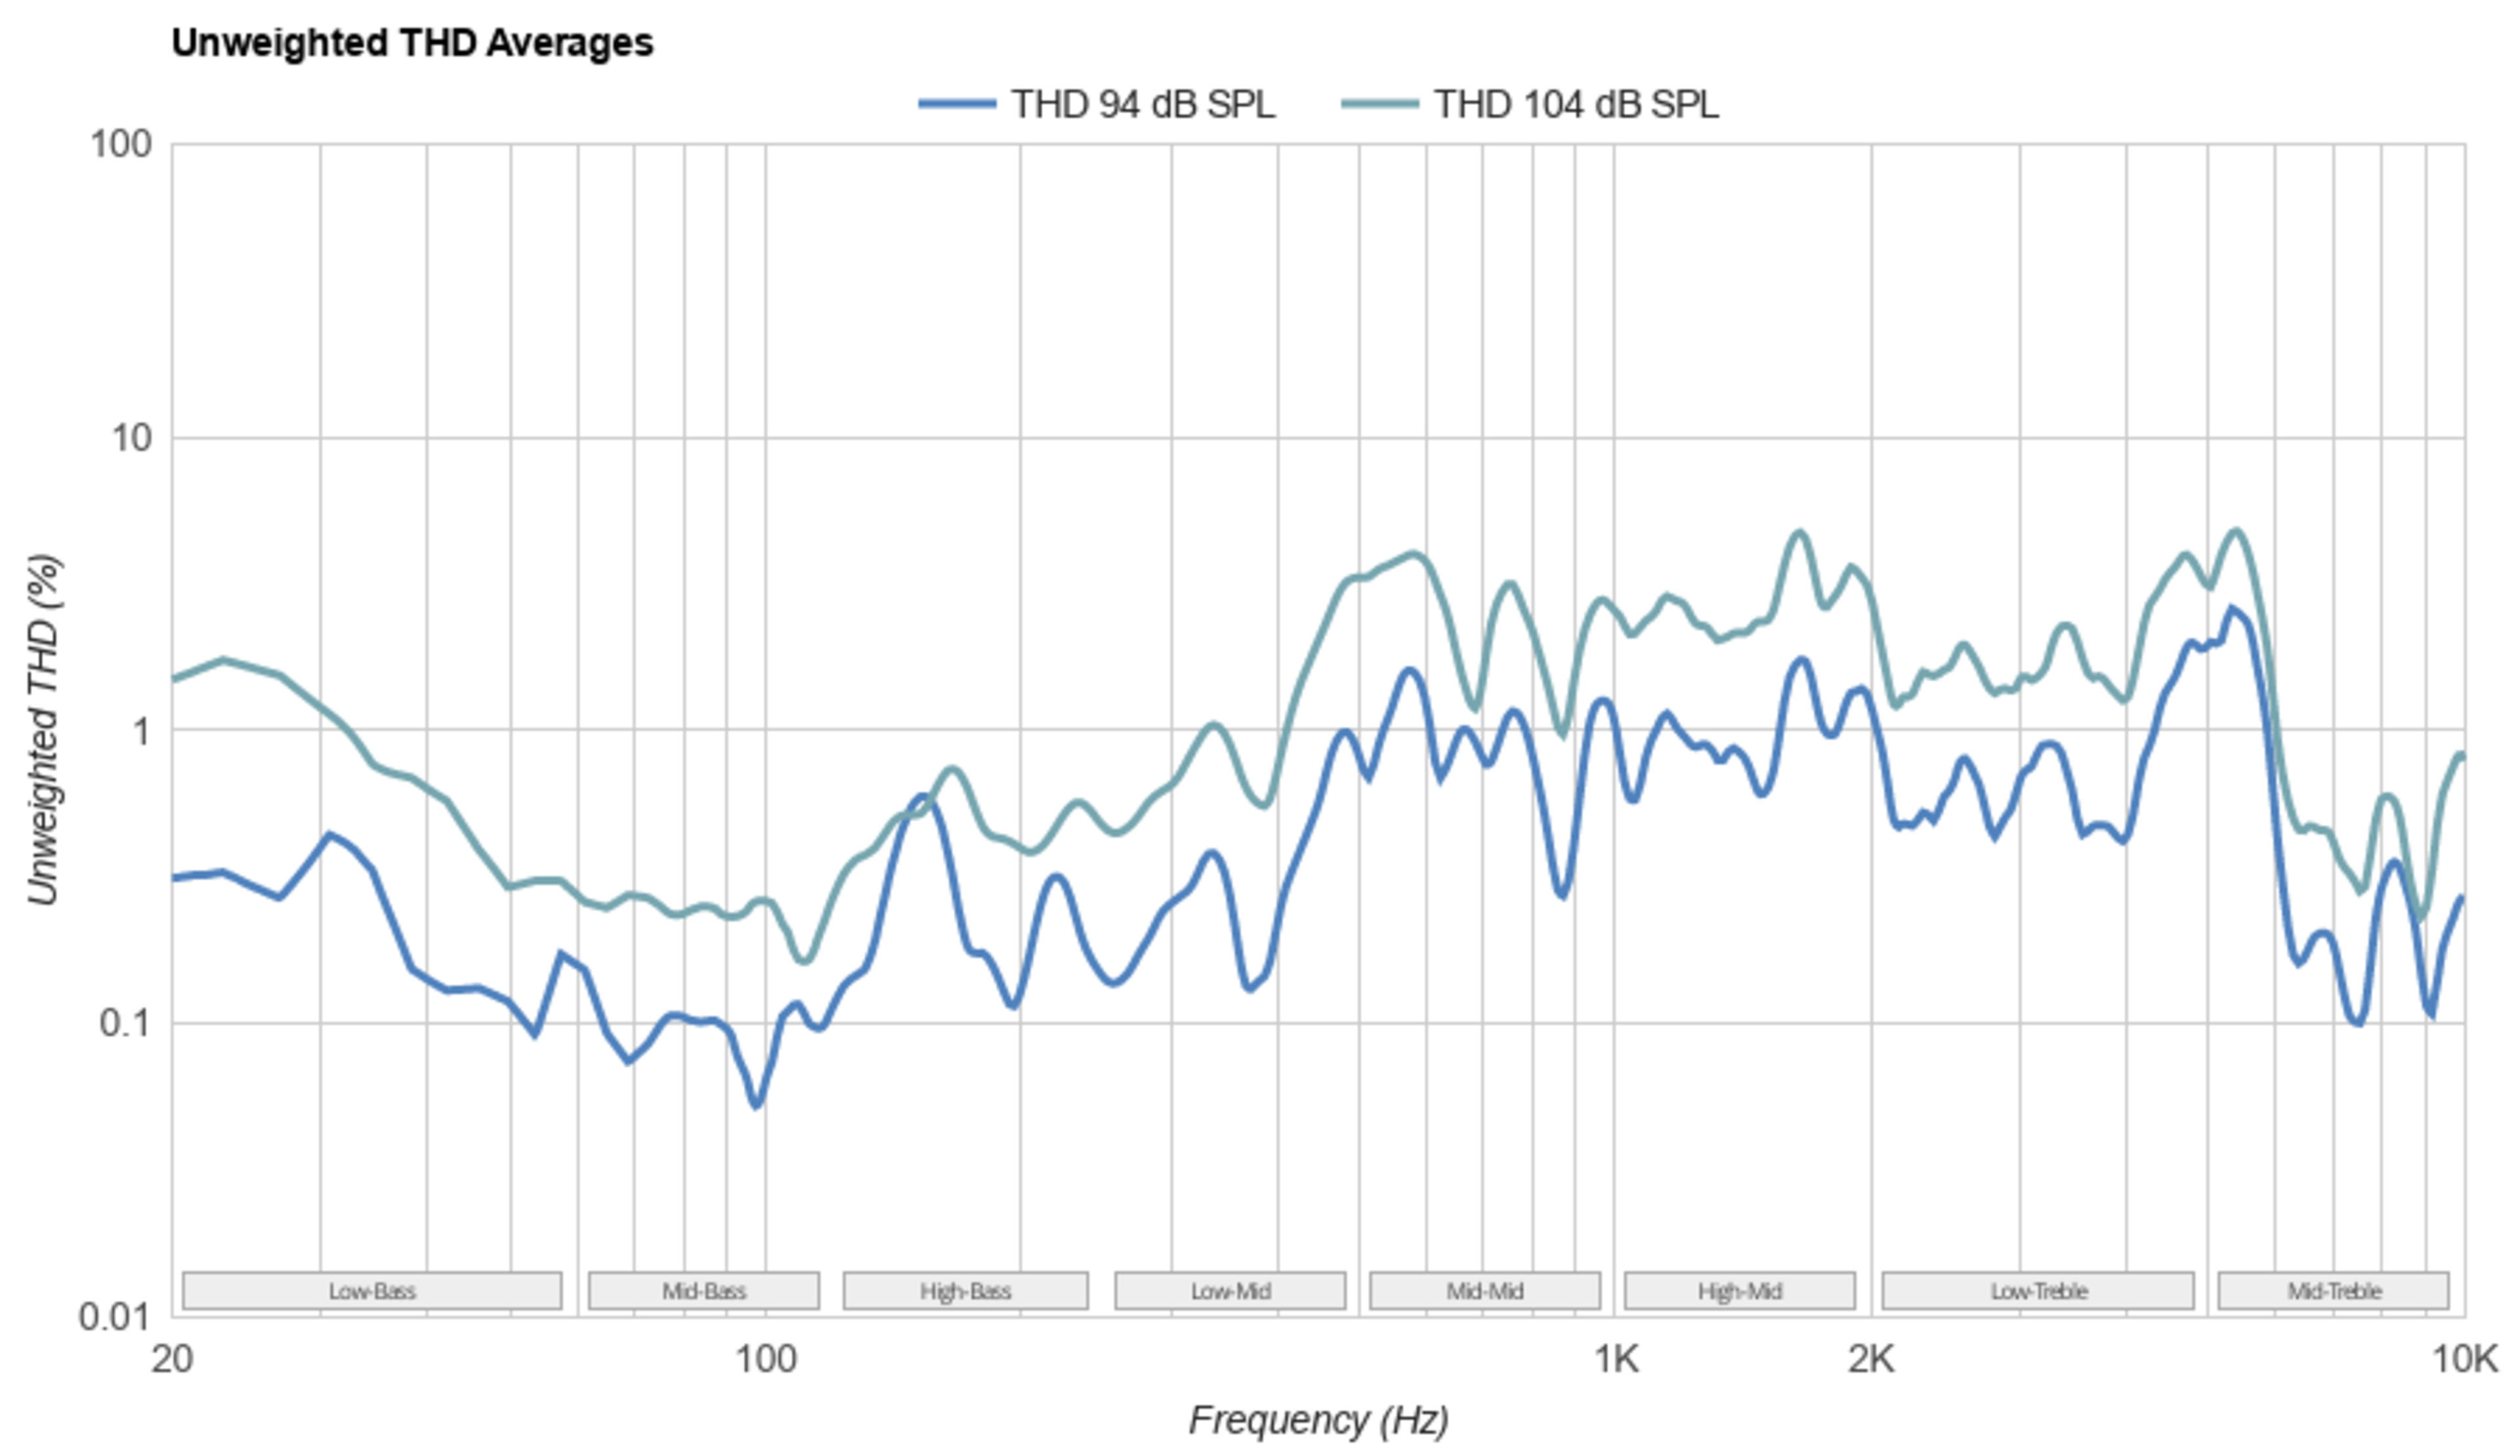
We perform the measurements at two different intensity levels: 94dBSPL and 104dBSPL. This allows us to test headphones at varying loudness levels that conform to industry standards. While we use a sample rate of 96kHz for analog headphones, the sample rate varies for Bluetooth headphones. As a result, the THD results are capped at 10kHz since harmonics of higher frequencies would fall outside of the test bandwidth with lower sample rates. We then apply 1/9 octave smoothing to the final THD graph.
Total Harmonic Distortion
Harmonic distortion is the generation of overtones that are a whole number multiple of their respective fundamental frequencies. Inharmonic distortion differs from harmonic distortion by being the sum of the overtones that aren't integer multiples of the fundamental frequency. For example, if the original signal is a 100Hz sine wave, a system with second-order harmonic distortion would output a 200Hz tone in addition to the original 100Hz signal, and a system with inharmonic distortion would output a non-integer multiple, like 273Hz, in addition to the input. A noisy system would produce a random signal even in the absence of an input. Our test focuses on total harmonic distortion (THD), which refers to the ratio of the sum of the powers (RMS amplitude) of all the harmonics to the power (RMS amplitude) of the fundamental frequency.

Harmonics Levels
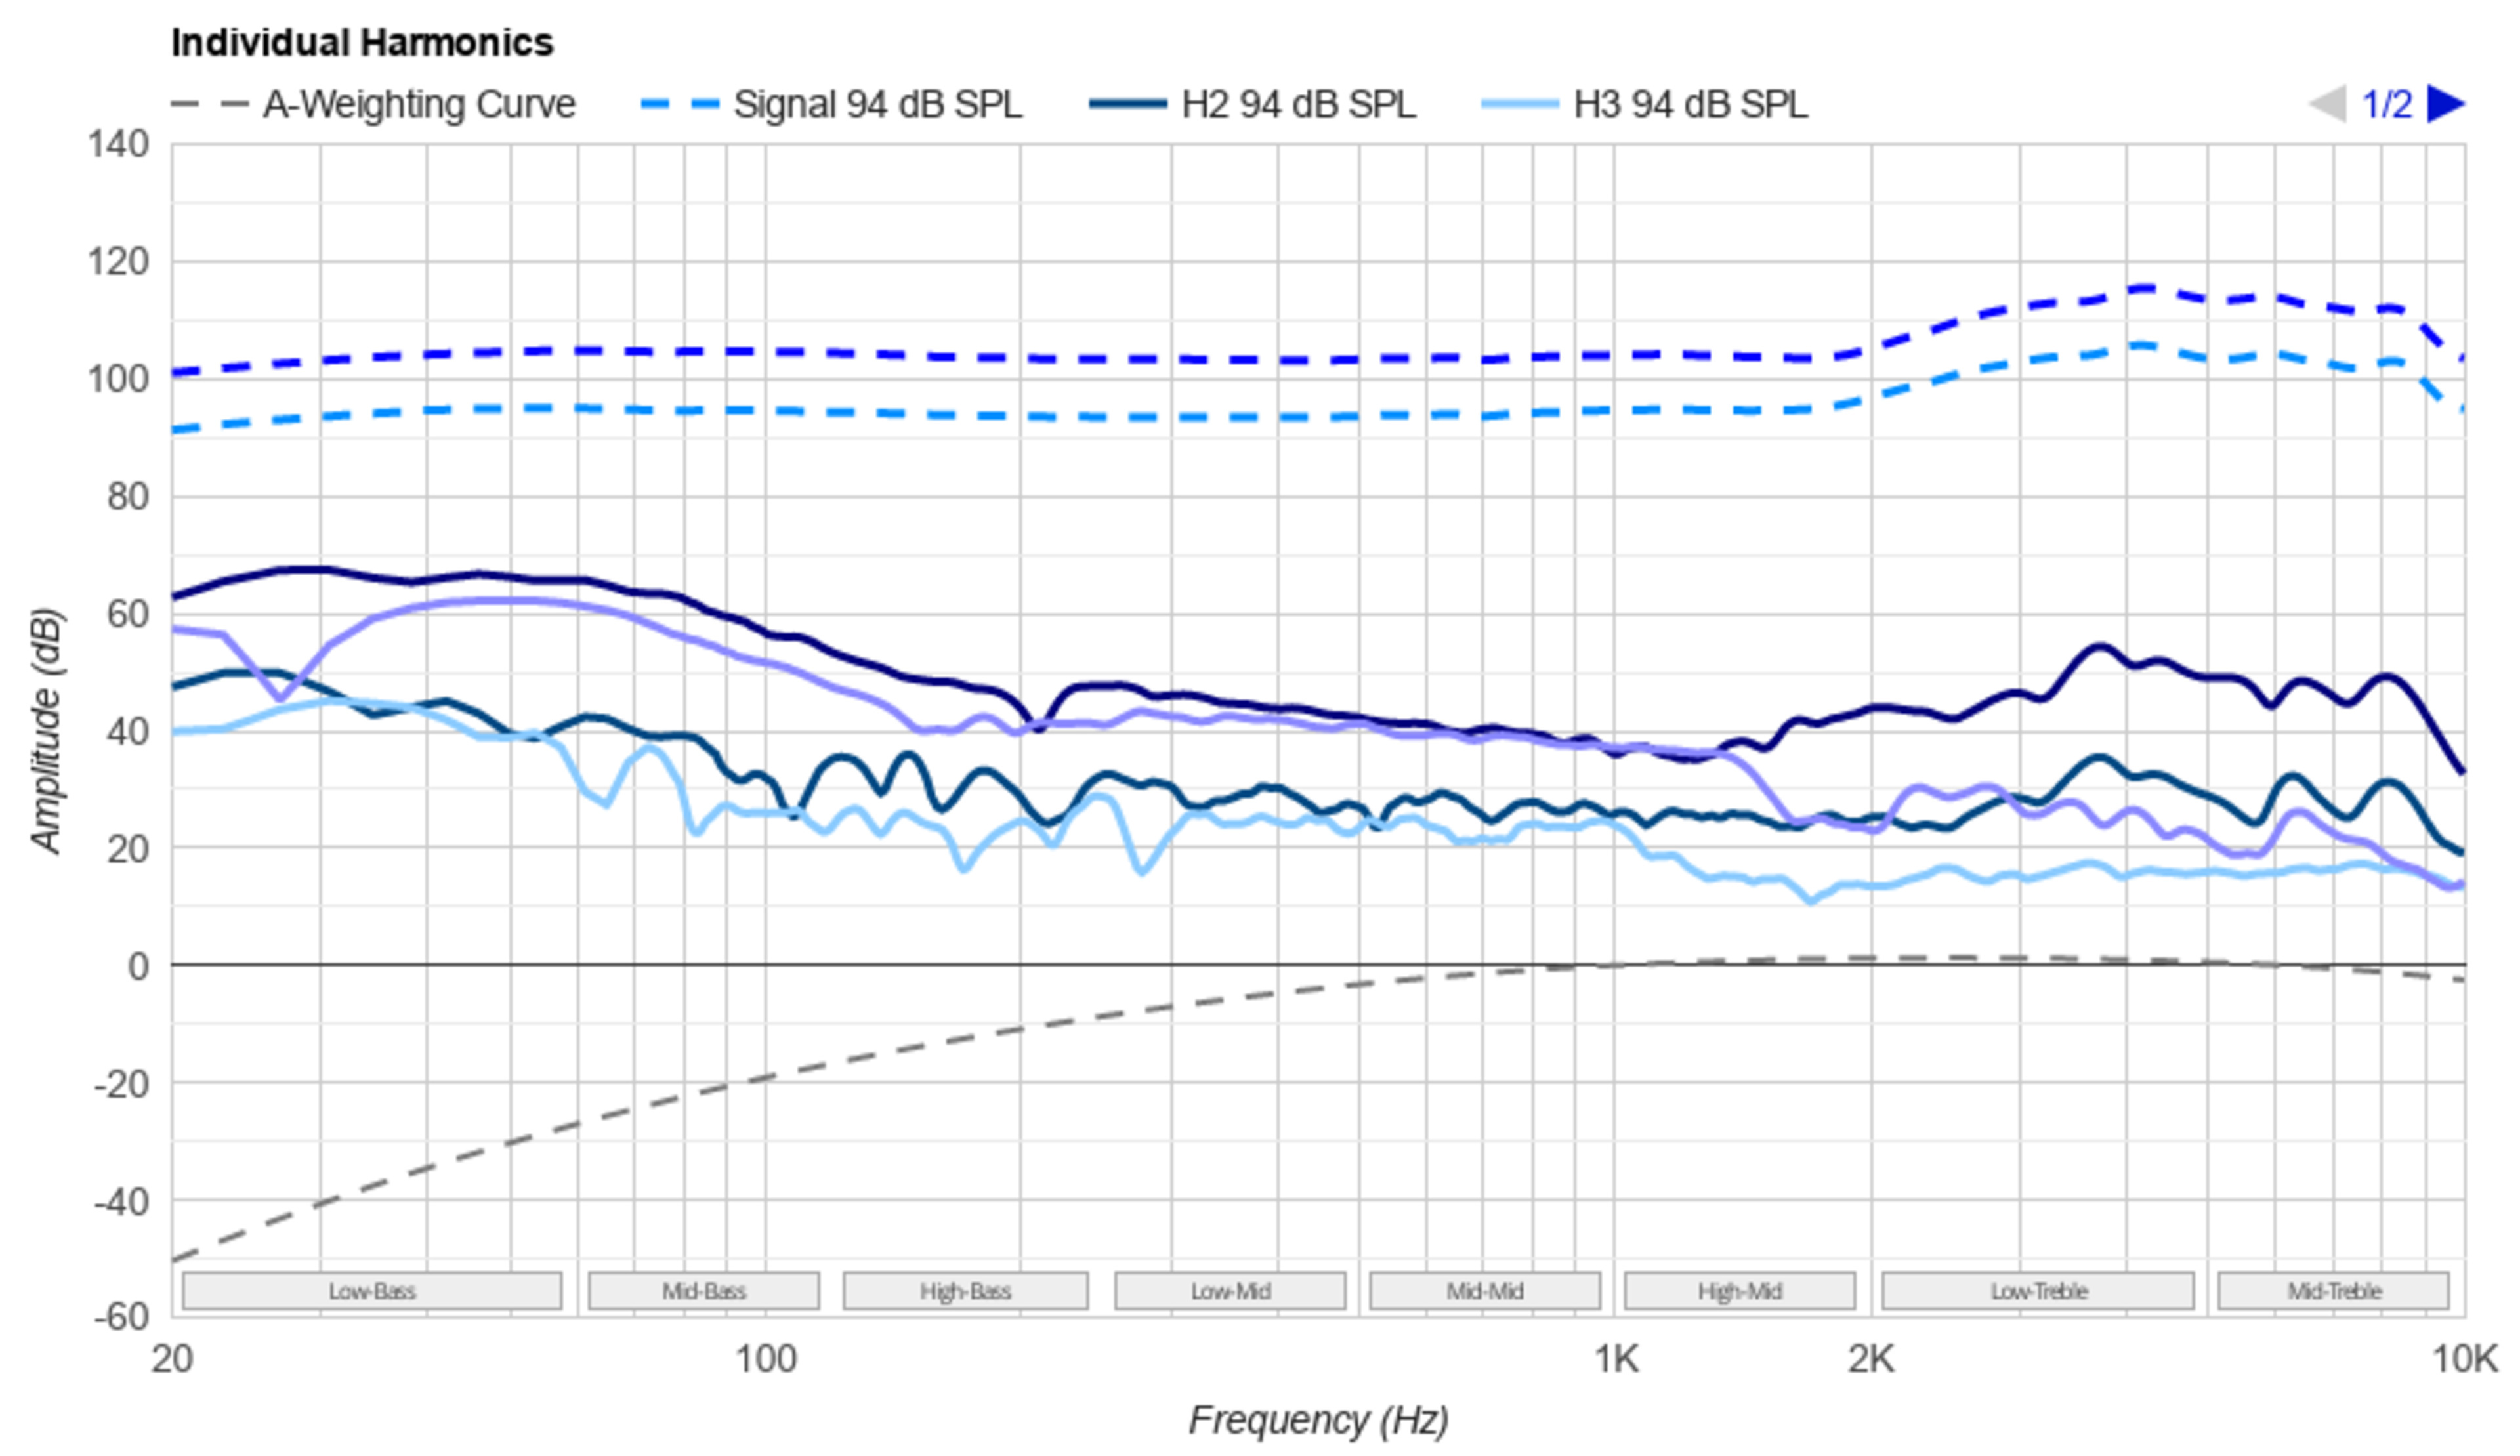
For those curious to see an intermediate step between the THD graph and weighted THD averages, we provide a graph that illustrates the second and third harmonics at 94 and 104dBSPL. We also include the A-weighting curve to further demonstrate how headphones' distortion performance translates to the weighted averages.
Weighted THD @ 94
Our test software (Audio Precision) calculates the THD (total harmonic distortion) of the 94dBSPL pass as a percentage of the fundamental frequency's power. Since speakers and headphones tend to produce more distortion in lower frequencies and human hearing is less sensitive to low-frequency harmonic distortion, we apply a weighting filter that takes individual harmonics into account. Higher harmonics are given more weight using the weighting coefficient -n²/4, first used by D. Shorter (Voishvillo, 2005). We A-weight these harmonics to account for the relative loudness the human ear perceives before an average is computed.
Weighted THD @ 104
The THD (total harmonic distortion) of the 104dBSPL pass is measured in the same way as the 94dBSPL one described above but with the volume set to 104dBSPL during the acoustic pass instead. While listening at this level can be inadvisable, it's worth considering the equal-loudness contours first suggested by Fletcher and Munson, which means that lower frequencies will lack the perception of loudness, even at this amplitude (Yost, 2020). Mid-range frequencies, by contrast, will be perceived as much louder. While most modern headphones' frequency responses feature such low levels of distortion that they will be inaudible even to trained ears, there are occasional outliers. Ultimately, however, we provide this measurement to meet current industry standards and showcase headphones' acoustic properties better.
Analysis
Although THD generally increases as the volume increases, some headphones show a decrease in THD in certain frequency bands as the volume increases.
As mentioned before, humans are quite tolerant of high levels of THD, especially in the bass range. As you can see below, some of the well-reputed and sought-after headphones produce seemingly significant amounts of THD. This doesn't mean that they're bad or unlistenable: the distortion produced by their drivers can be measured by our measuring rig but doesn't translate to a perceptible change in sound quality. You can check out this video by Julian Krause which explores our ability to perceive harmonic distortion in polyphonic music and test tones of different frequencies.
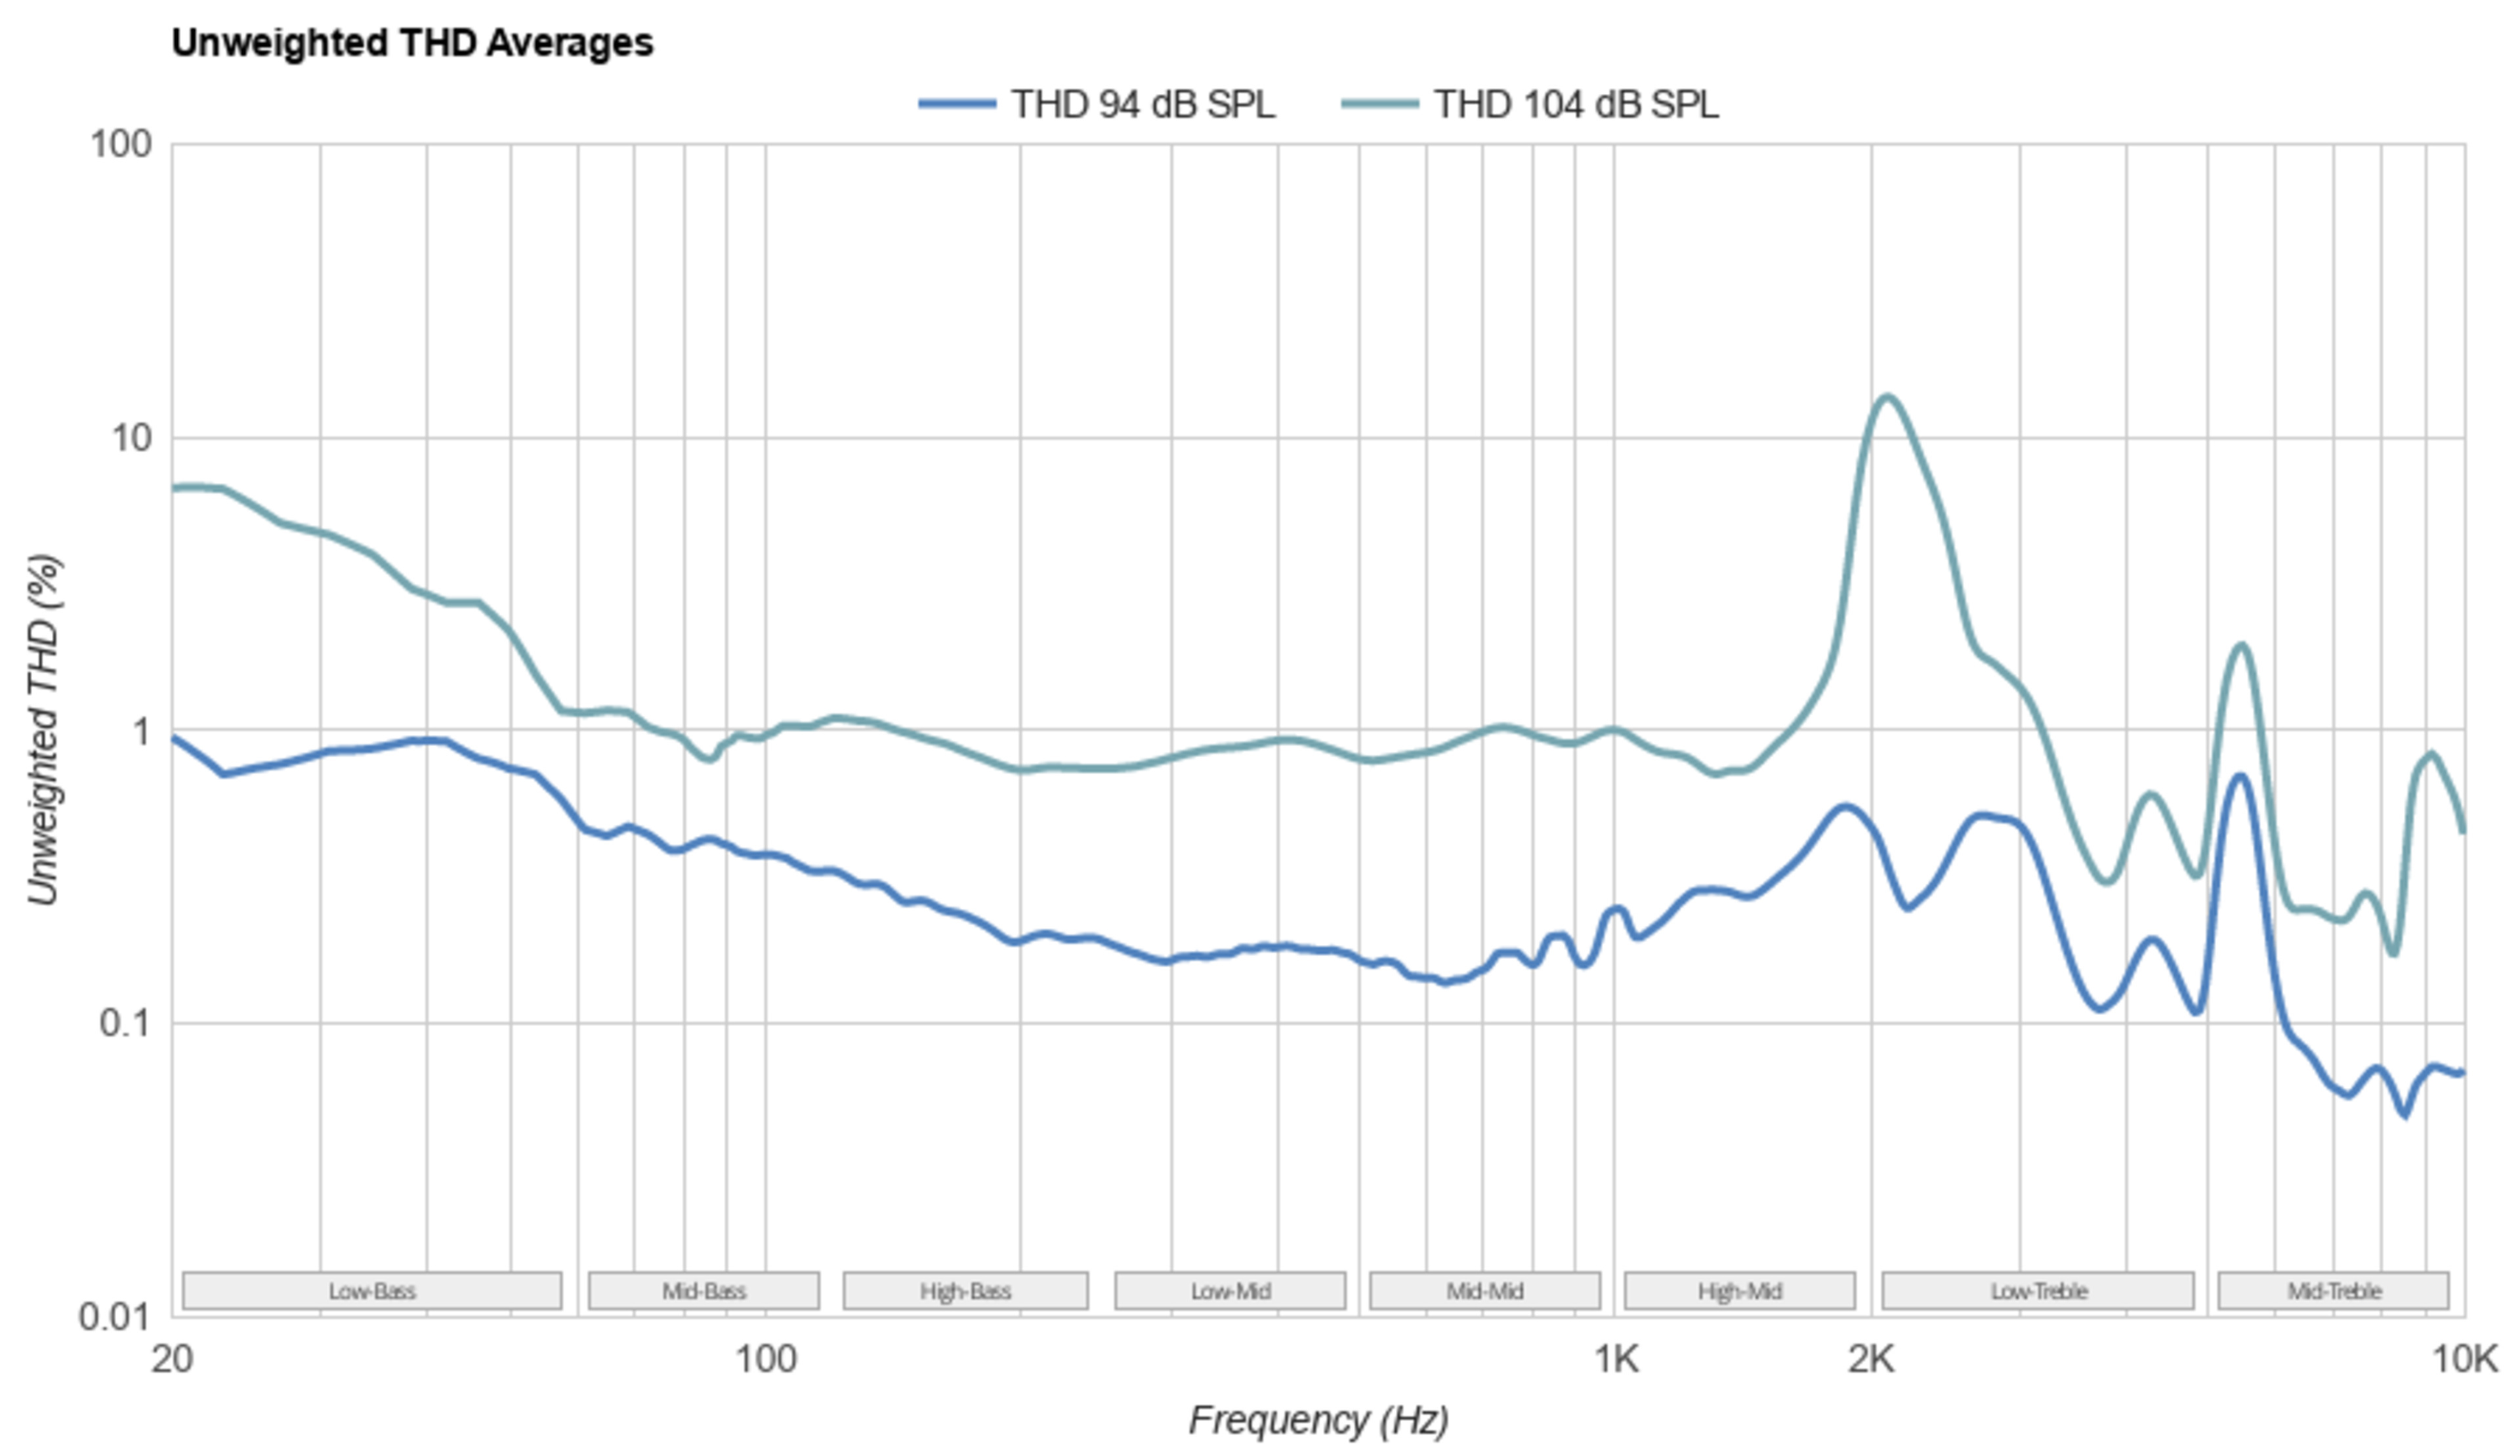
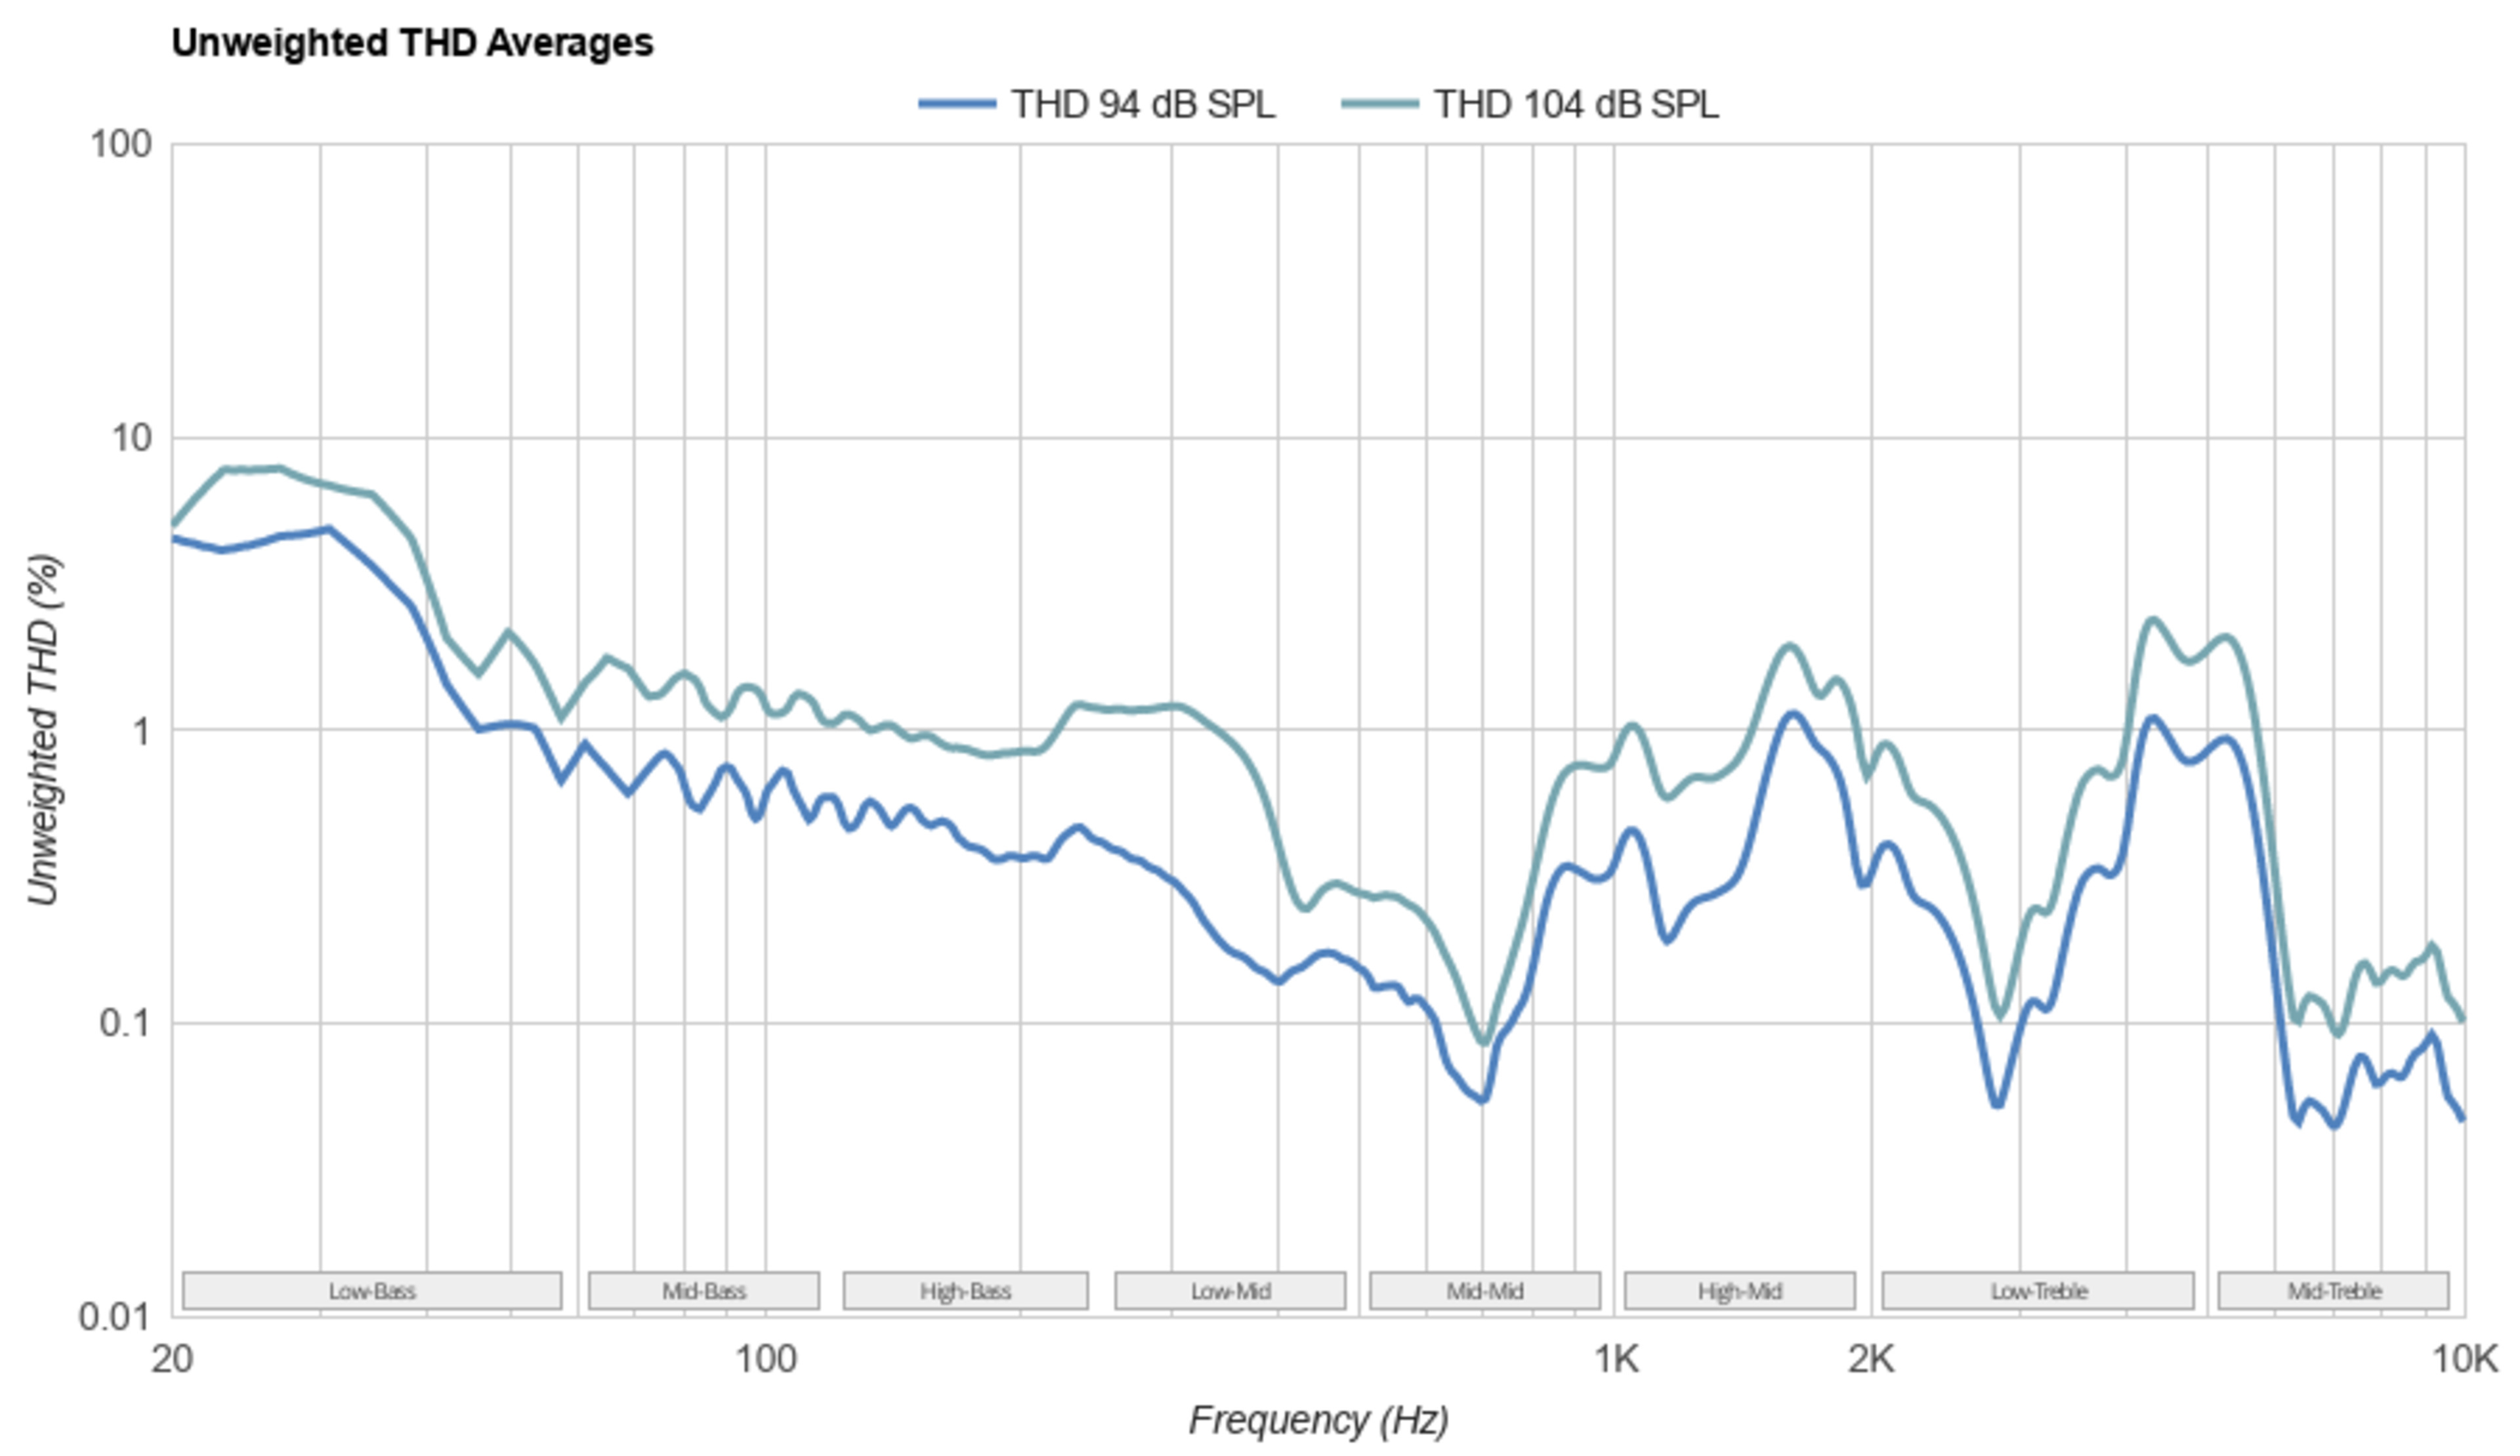
One of the factors that affect the audibility of THD is masking. Auditory masking occurs when the perception of one sound is affected by the presence of another sound. In the case of spectral masking, when two tones that are near in frequency are produced, the louder tone drowns out the quieter one. Therefore, lower-order harmonic distortion tends to be less audible since it has a better chance of being masked by the fundamental frequency. This also means that spikes in THD tend to be more audible than a constant elevation in THD.
In summary, while THD is the most established measure of distortion for headphones and other audio devices, it comes with certain limitations. Almost all commercially available headphones will exhibit levels of distortion that are imperceptible to the human ear. However, trained listeners may be able to perceive it at lower levels than the average user. While we apply a weighting filter to our measurements that factor in equal-loudness contours and the greater sensitivity of our ears to high-order harmonic distortion, our harmonic distortion tests still come with limitations (which are explored further below). That said, our measurements can still give general insight into the acoustic properties of the headphones we test.
Additional Information
Although THD has been a staple of audio measurements and specifications, studies have shown that there is only a moderate correlation between the THD response of a device and its perceived audio fidelity (Temme et al., 2014) (Geddes et al., 2003). Depending on the ratios between the different harmonics produced by a device, auditory masking, and other psychoacoustic effects, headphones with high THD levels can produce very few audible effects. This could also be because harmonic distortion is measured with a single tone sweep, which may not be able to put headphones under as much load as a full-spectrum, bass-heavy piece of music. The more dense nature of polyphonic music can result in a larger number of intermodulation products that are less easily masked (Voishvillo, 2006). Therefore, it's possible for more audible distortion to be detected in full-spectrum music, though this falls outside the scope of our tests.
Other methods for measuring distortion, such as inter-modulation distortion (IMD), multi-tone distortion, non-coherent distortion (Brunet et al., 2006), and PEAQ (Perceptual Evaluation of Audio Quality), have been proposed and studied . Among these, non-coherent distortion has been proven to be a more significant indicator of audio fidelity. New methods have been developed for interpreting THD, such as the GedLee metric, which incorporates auditory masking and other psychoacoustic phenomena into their calculations.
Works Cited
Geddes, Earl R., and Lidia W. Lee. 'Auditory Perception of Nonlinear Distortion'. GedLee LLC, 2003.