- Table of Contents
- Intro
- When It Matters
- Our Tests
- Conclusion
- Recent Updates
- Comments
Our Headphone Sound Quality Tests
Raw Frequency Response
Frequency response can make or break a buying decision. In its simplest summation, it tells us how accurately a pair of headphones reproduces audio across a spectrum of frequencies. In its most technical definition, it's a measure of the magnitude of the output of a system compared to its input as a function of frequency. For example, if an input signal has three frequencies of equal amplitude (100Hz, 1kHz, and 10kHz, all at -6 dB FS), then a pair of headphones with a flat frequency response would output the same signal as the input: equal amplitudes at 100Hz, 1kHz, and 10kHz.
This article covers our Raw Frequency Response test, which is a key part of how we test headphones. We evaluate a pair of headphones' frequency response from 20Hz to 20kHz, numbers which more or less correspond to the lower and upper limits of human hearing. We re-measure and re-seat each headphone multiple times, and the final frequency response plot is the average of those measurements.
If all this sounds a little bit too technical for you, check out our Sound Profile article, which helps explain how the frequency response of a pair of headphones relates to the sound you can expect to hear. And if you're looking for a little more detail on how we arrived at the target curve we use to assess a headphone's sound profile, check out our R&D article, which explores these topics at length.
Test results
When It Matters
Frequency response is one of the most important parts of audio reproduction. Although it can be objectively measured using a test rig and specialized equipment, a large part of understanding this phenomenon comes down to subjective preference and use case. If you like more bass or less treble, you'll want to see how the frequency response performs in these ranges. Similarly, if you're an audio engineer looking to mix and master tracks, you may want headphones with a more balanced or flat sound, whereas gamers may prefer a bump in the high bass to emphasize sound effects.
We use the raw frequency response and the sound profile in our reviews to highlight our measurements. If you're an experienced user, the raw frequency response allows you to interpret and evaluate the data without compensation. You can also see the responses of the left and right drivers separately, which can give you some sense of how well matched the drivers are. But if you need a hand making sense of all of this, you'll want to check the Sound Profile, which 'flattens' the response by applying our target curve to it. In other words, this test more easily shows how the sound profile deviates from our target by representing the target as a straight line and the frequency response as deviations.
Check out this example of the HiFiMan Sundara 2020 below:
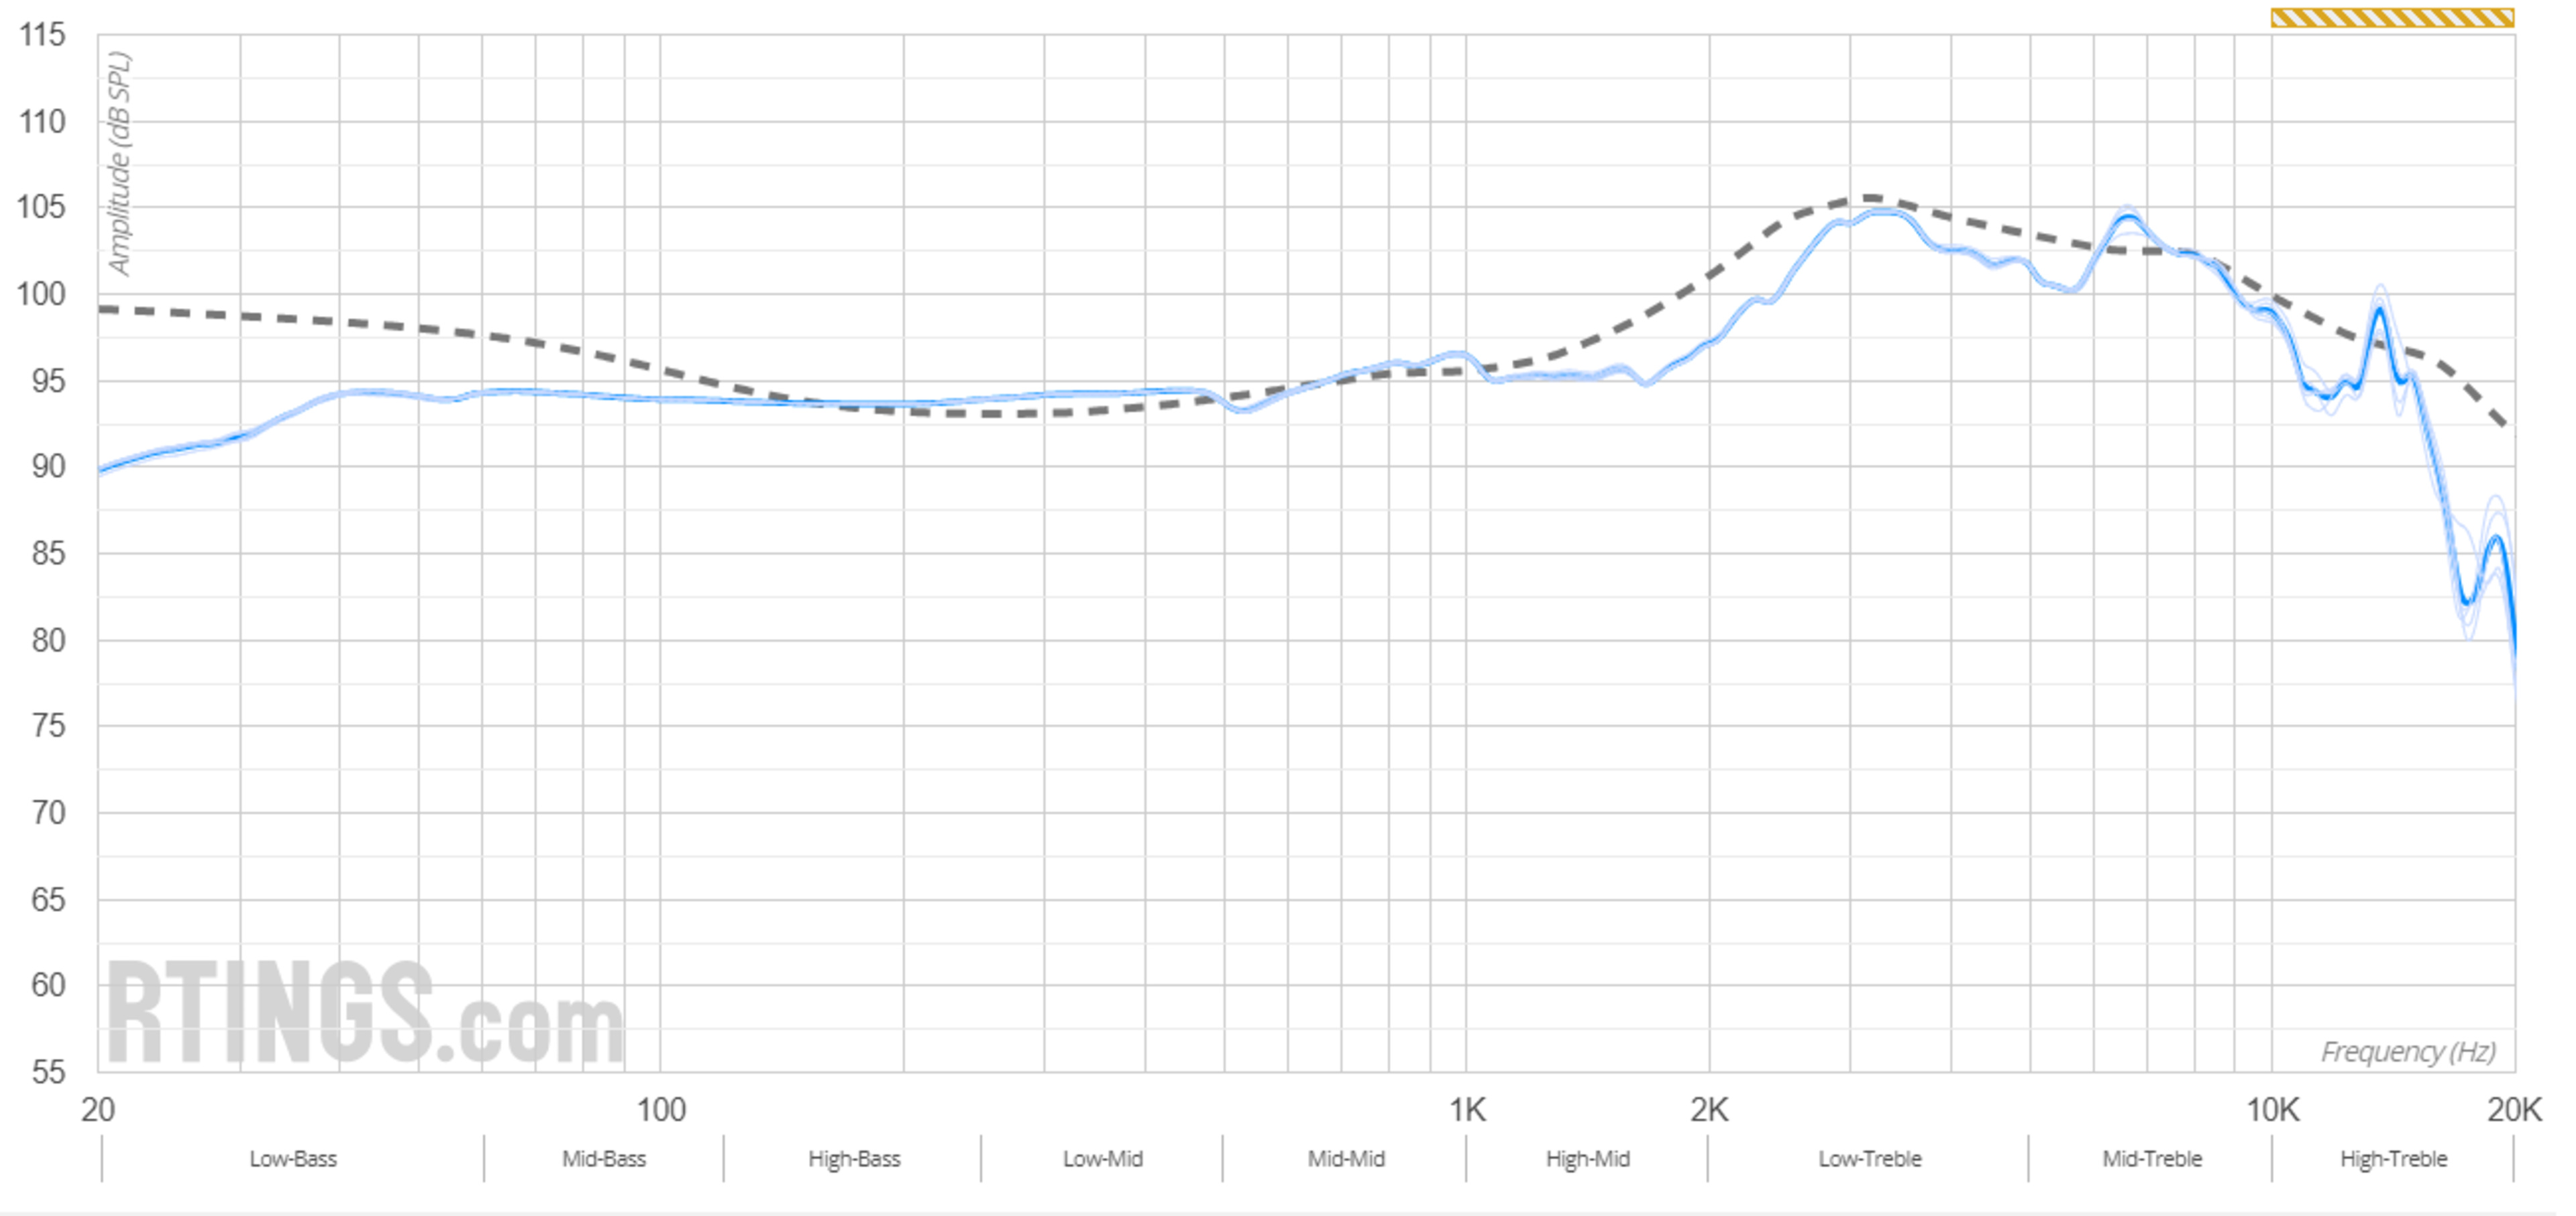 | 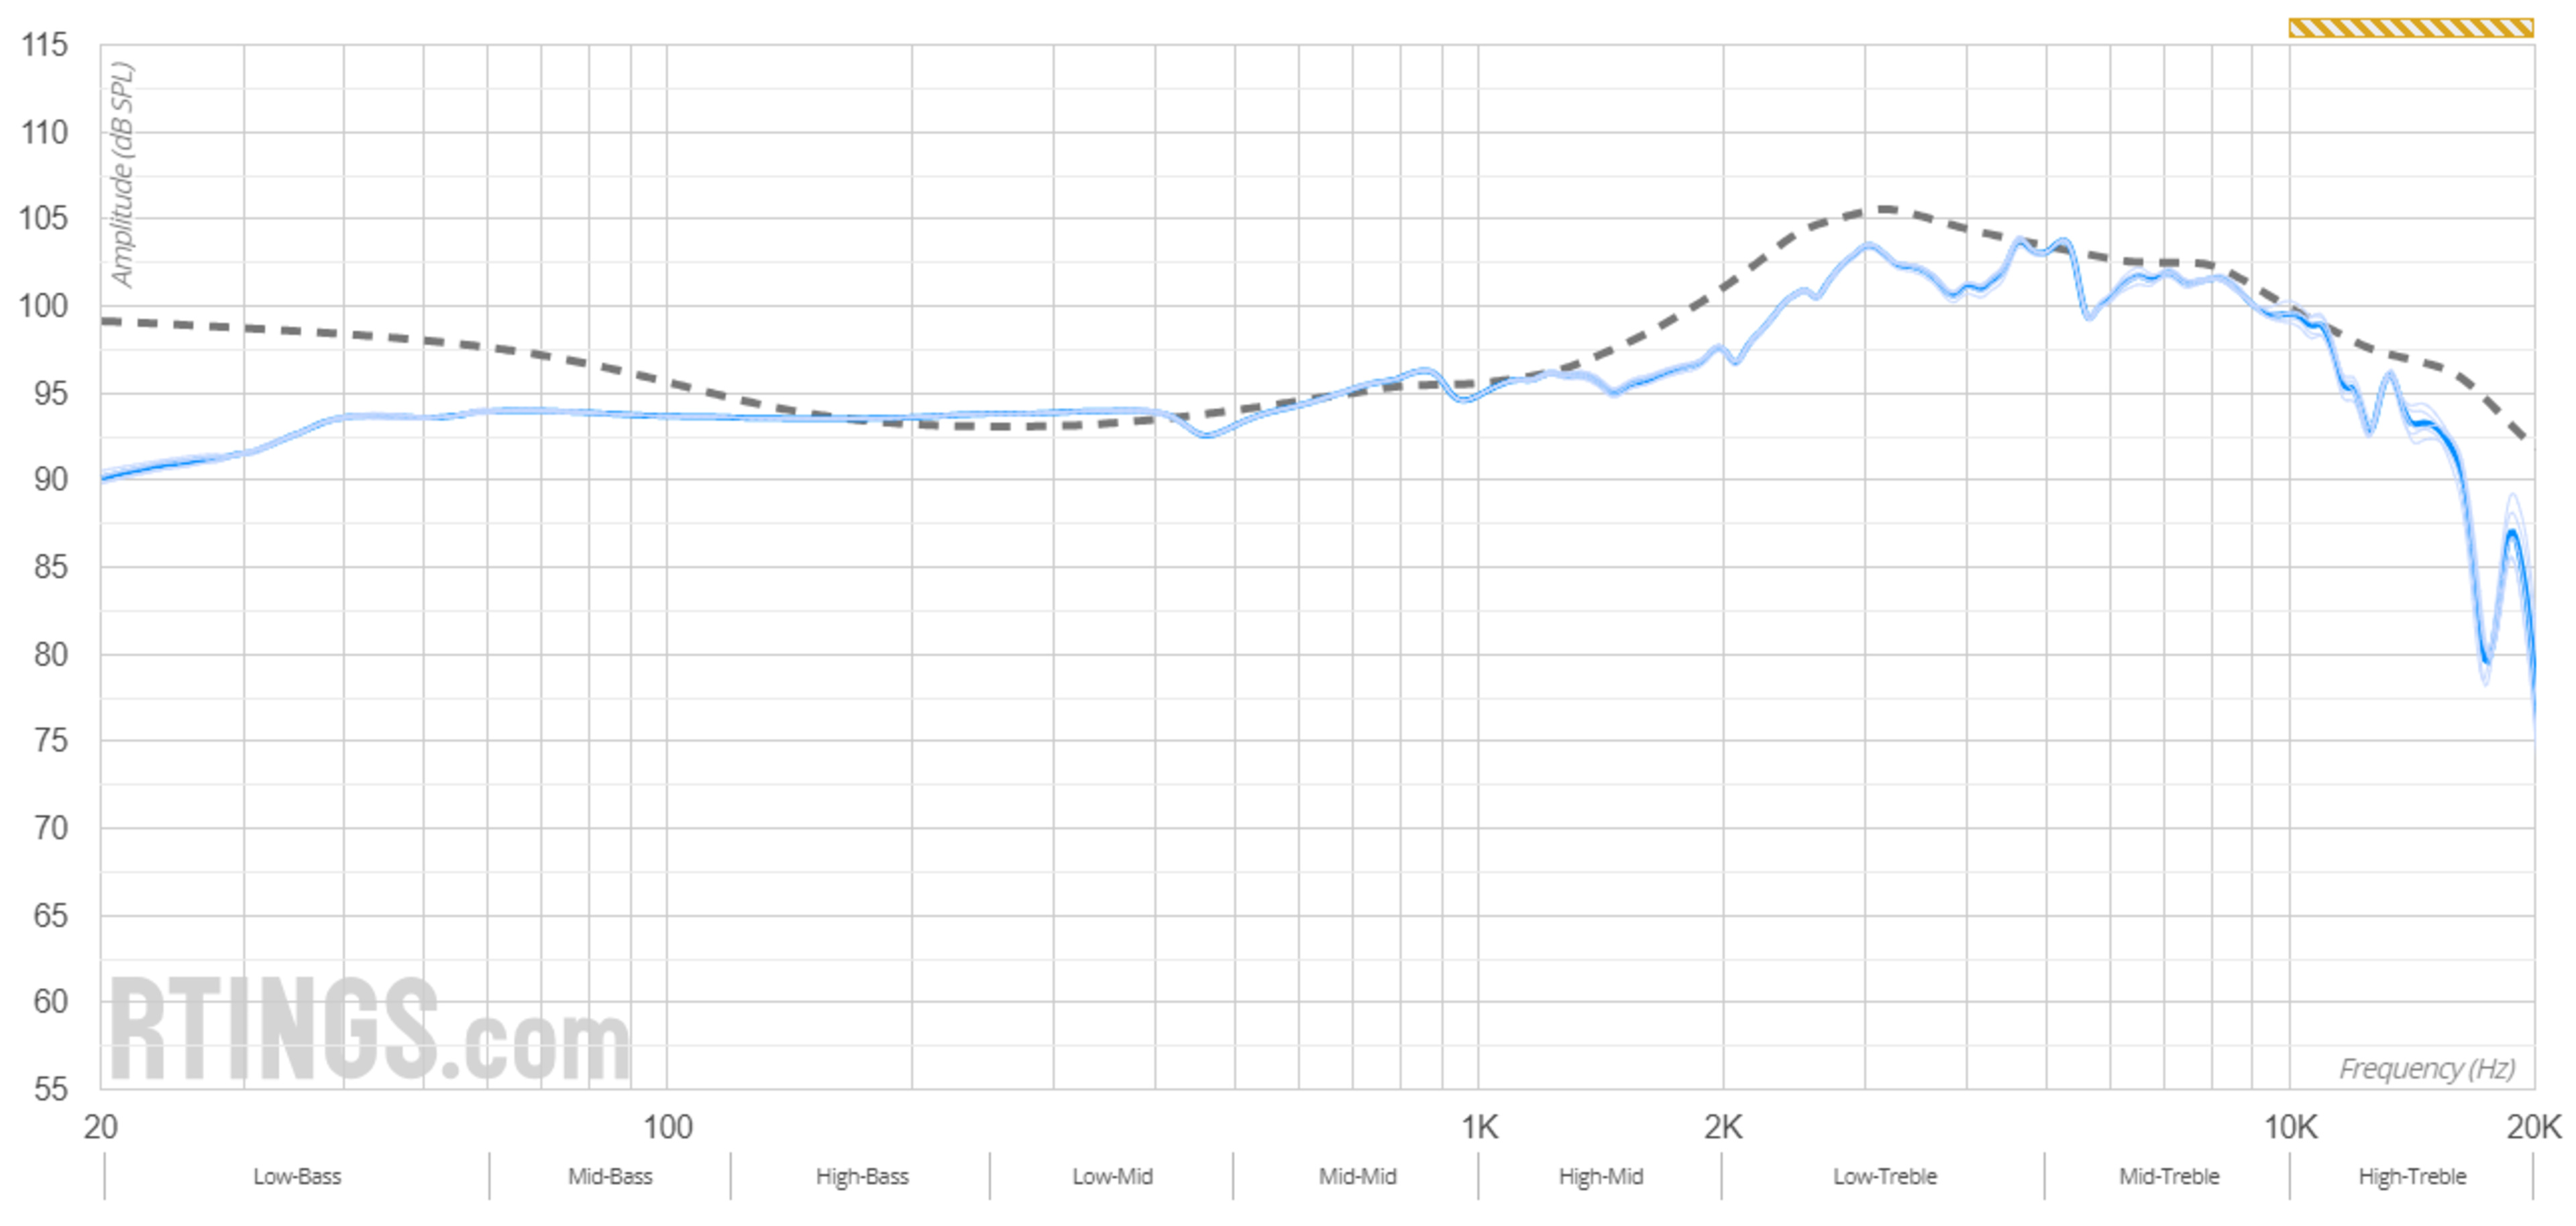 | 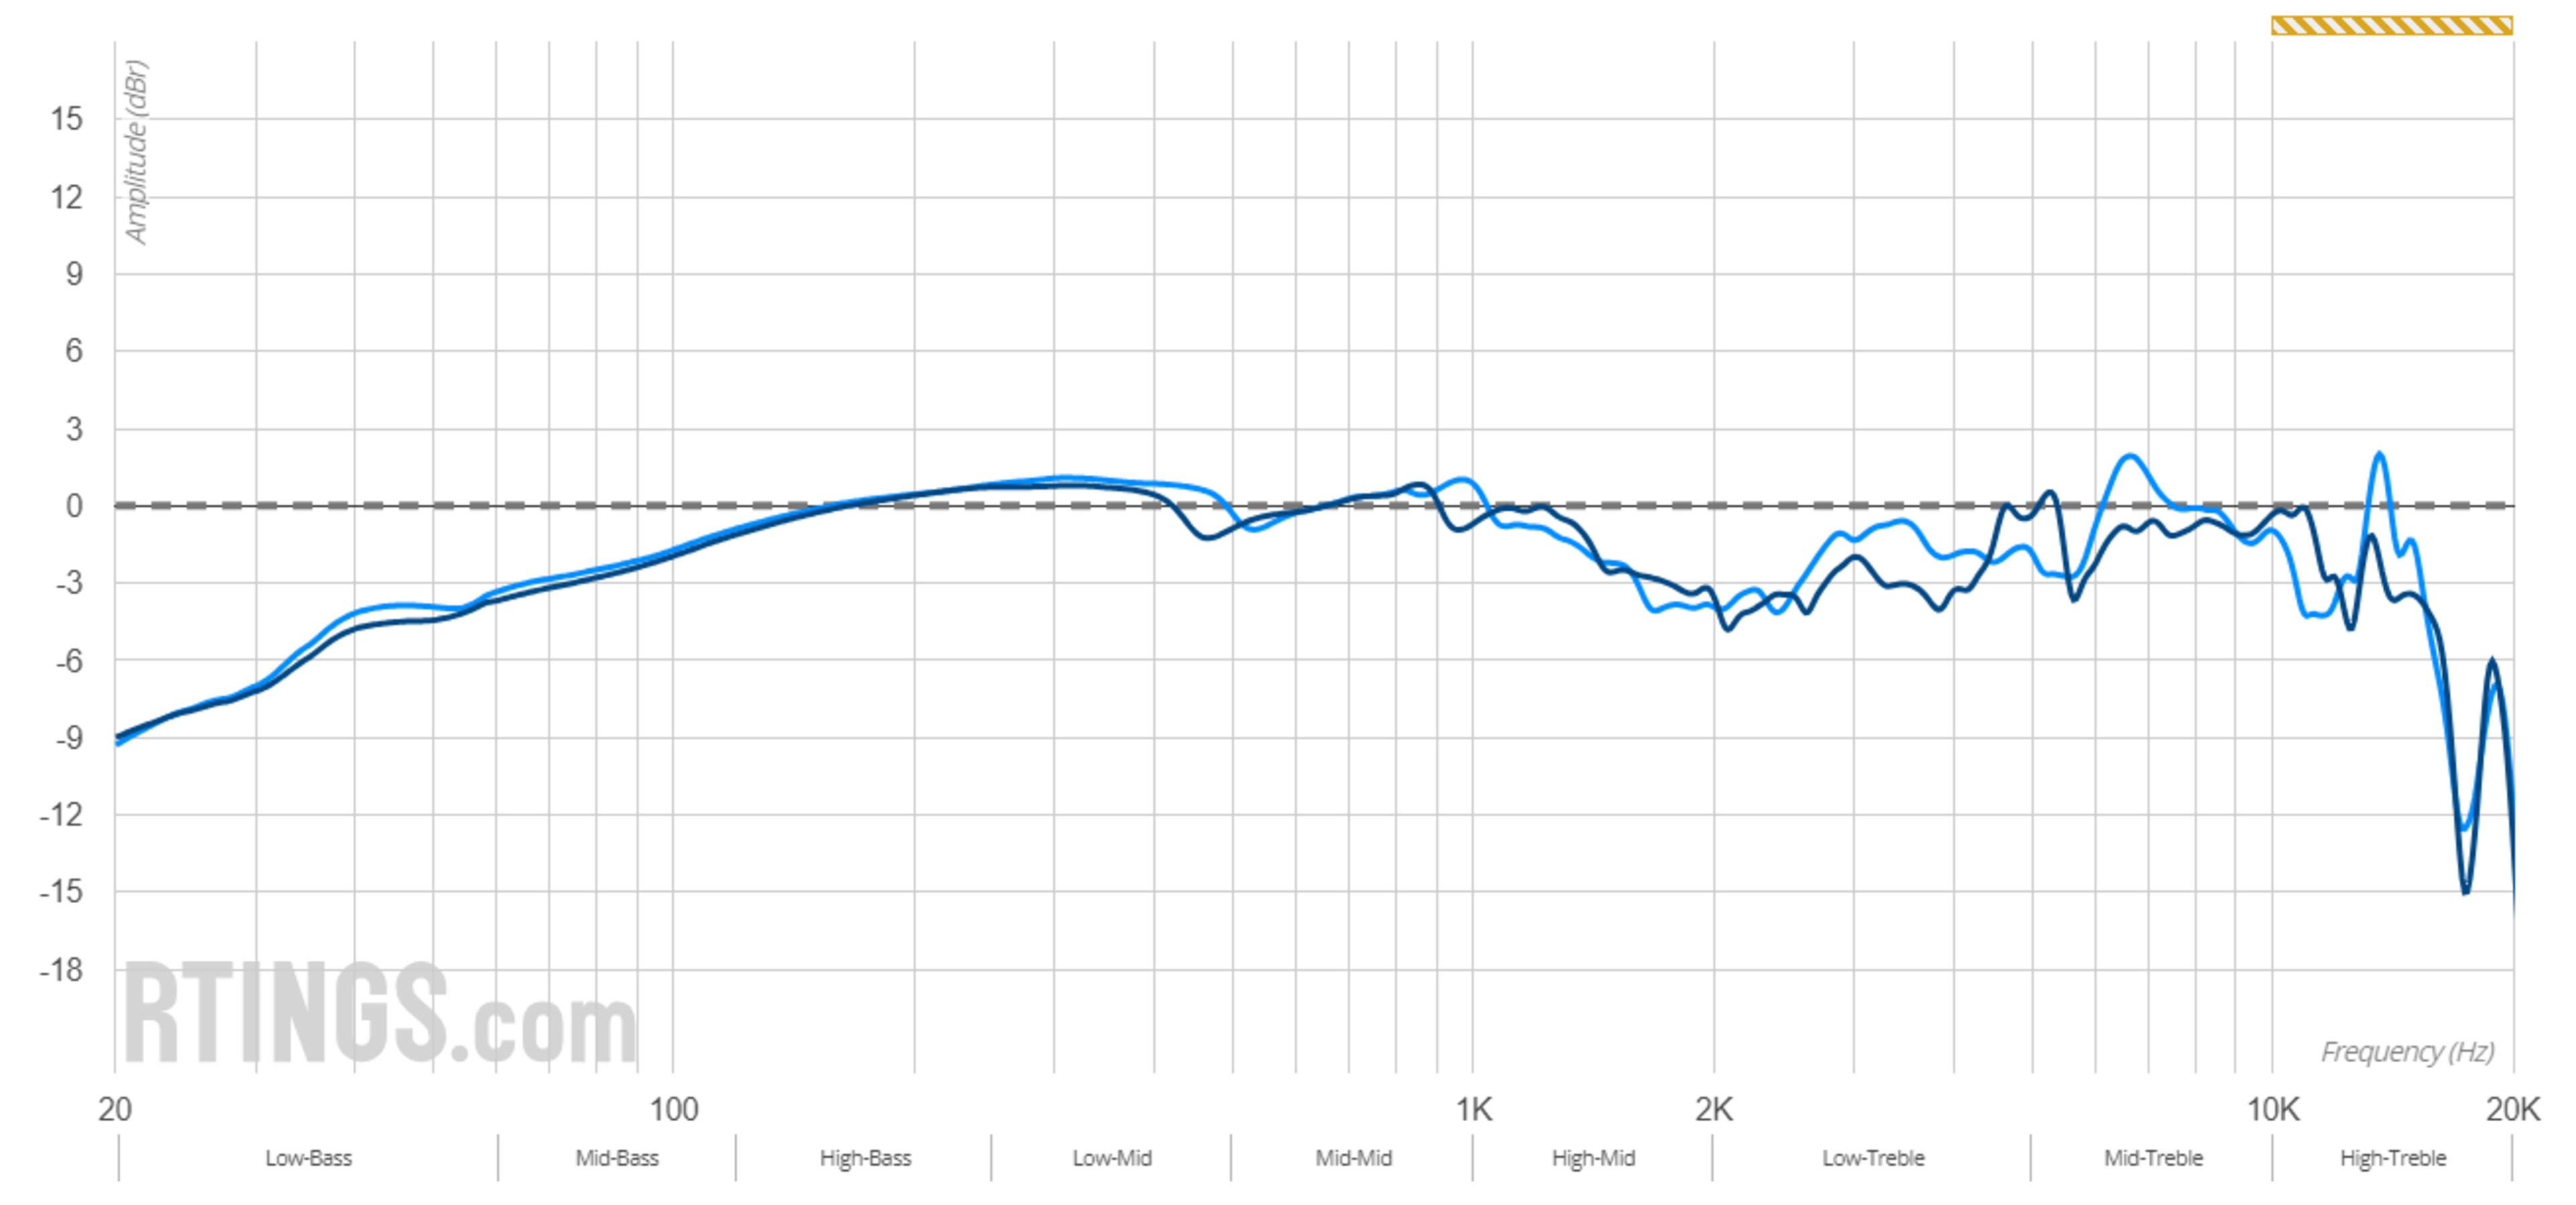 |
All three graphs represent similar data: they reflect the frequency response measurements of the headphones in relation to our target curve. Where they differ (at least between raw frequency response and sound profile) is how that data is represented. The left and right raw responses are uncompensated, while the sound profile graph is adjusted against our target (the flat dotted line).
Our Raw Frequency Response test has a further benefit: it allows you to more easily compare our results with those from other sources. Of course, since different reviewers use different rigs, you can't necessarily make one-to-one comparisons. But if you know that you like the sound of one pair of headphones with a specific frequency response graph, you can use the raw frequency response data in our Table Tool to see at a glance whether other headphones we've reviewed approximate that response. As an added bonus, for headphones reviewed under Test Bench 2.0 and later, you can now use the Graph Tool to compare the frequency response to targets from a number of other outlets, including SoundGuys.com. Over time, the more you understand why you like a pair of headphones, the better equipped you'll be to pick new headphones that will work for you.
Finally, it's worth noting that if you're using our graph tool, you'll see that the highest portion of the treble range is highlighted in yellow. That's because measurements in this range are uncertain; there's variance in human ear morphology, so what you may experience in this range may deviate from our measurements.
Our Tests
Testing Procedure
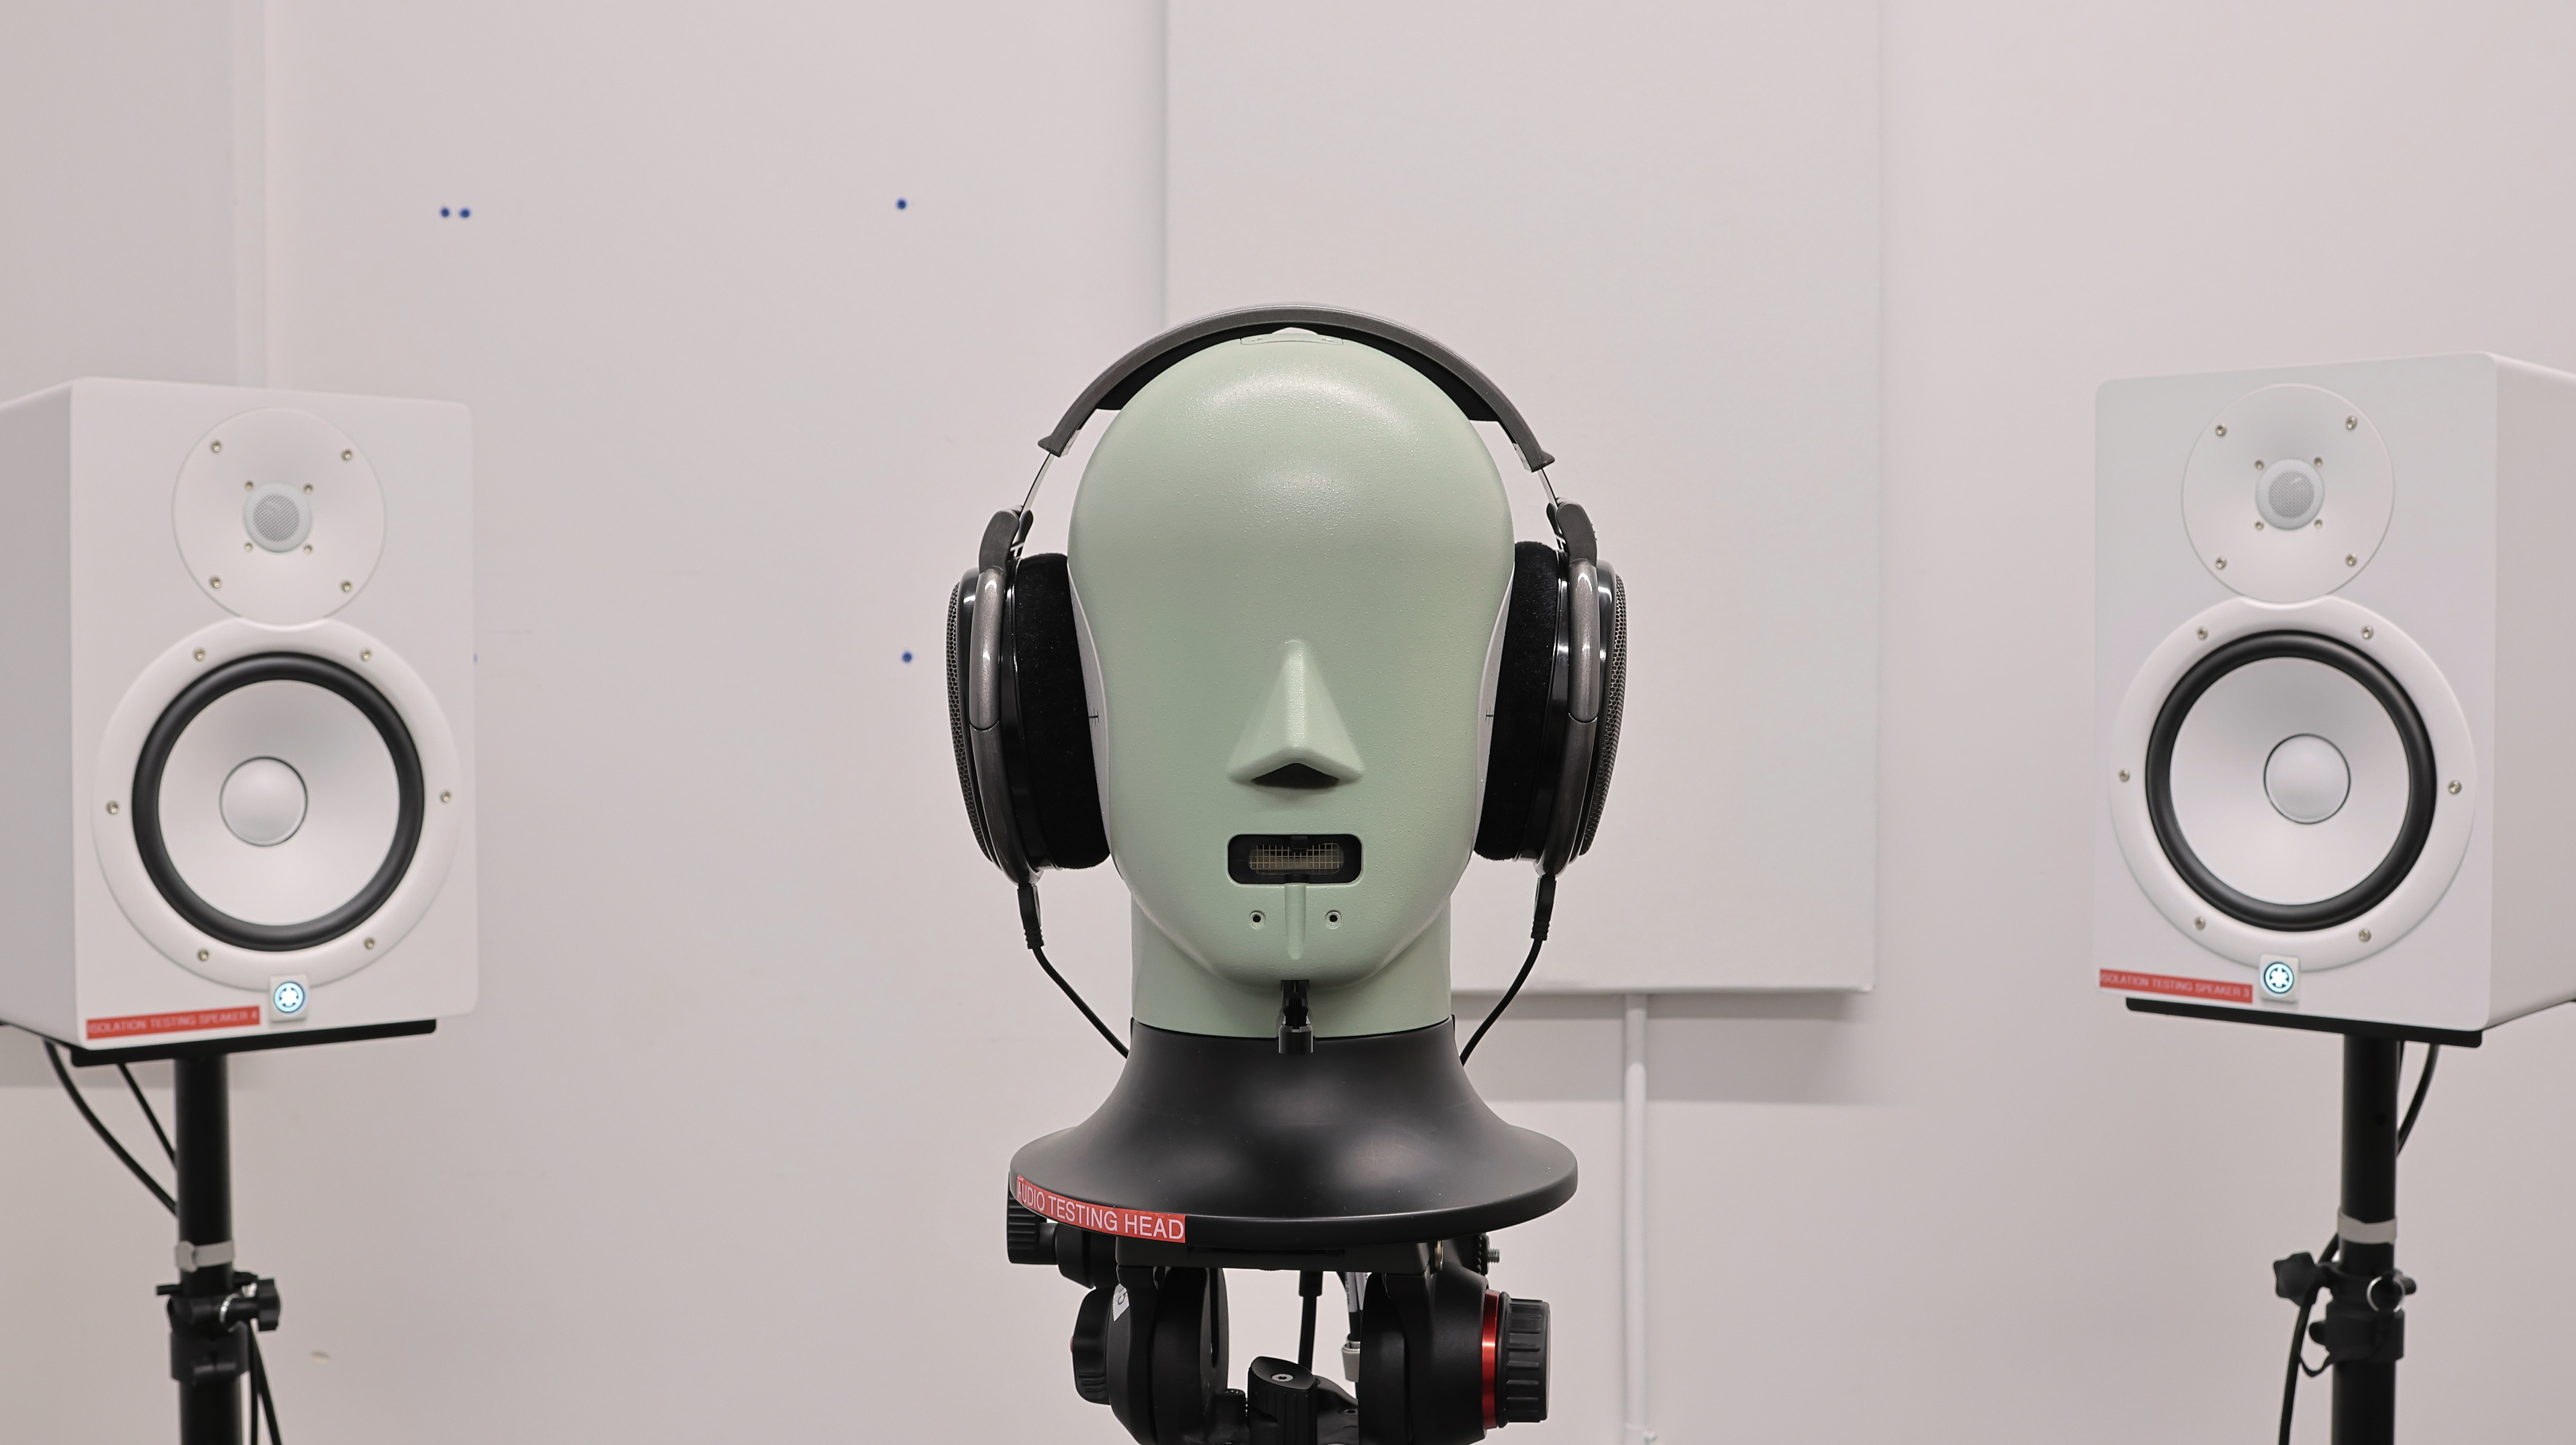
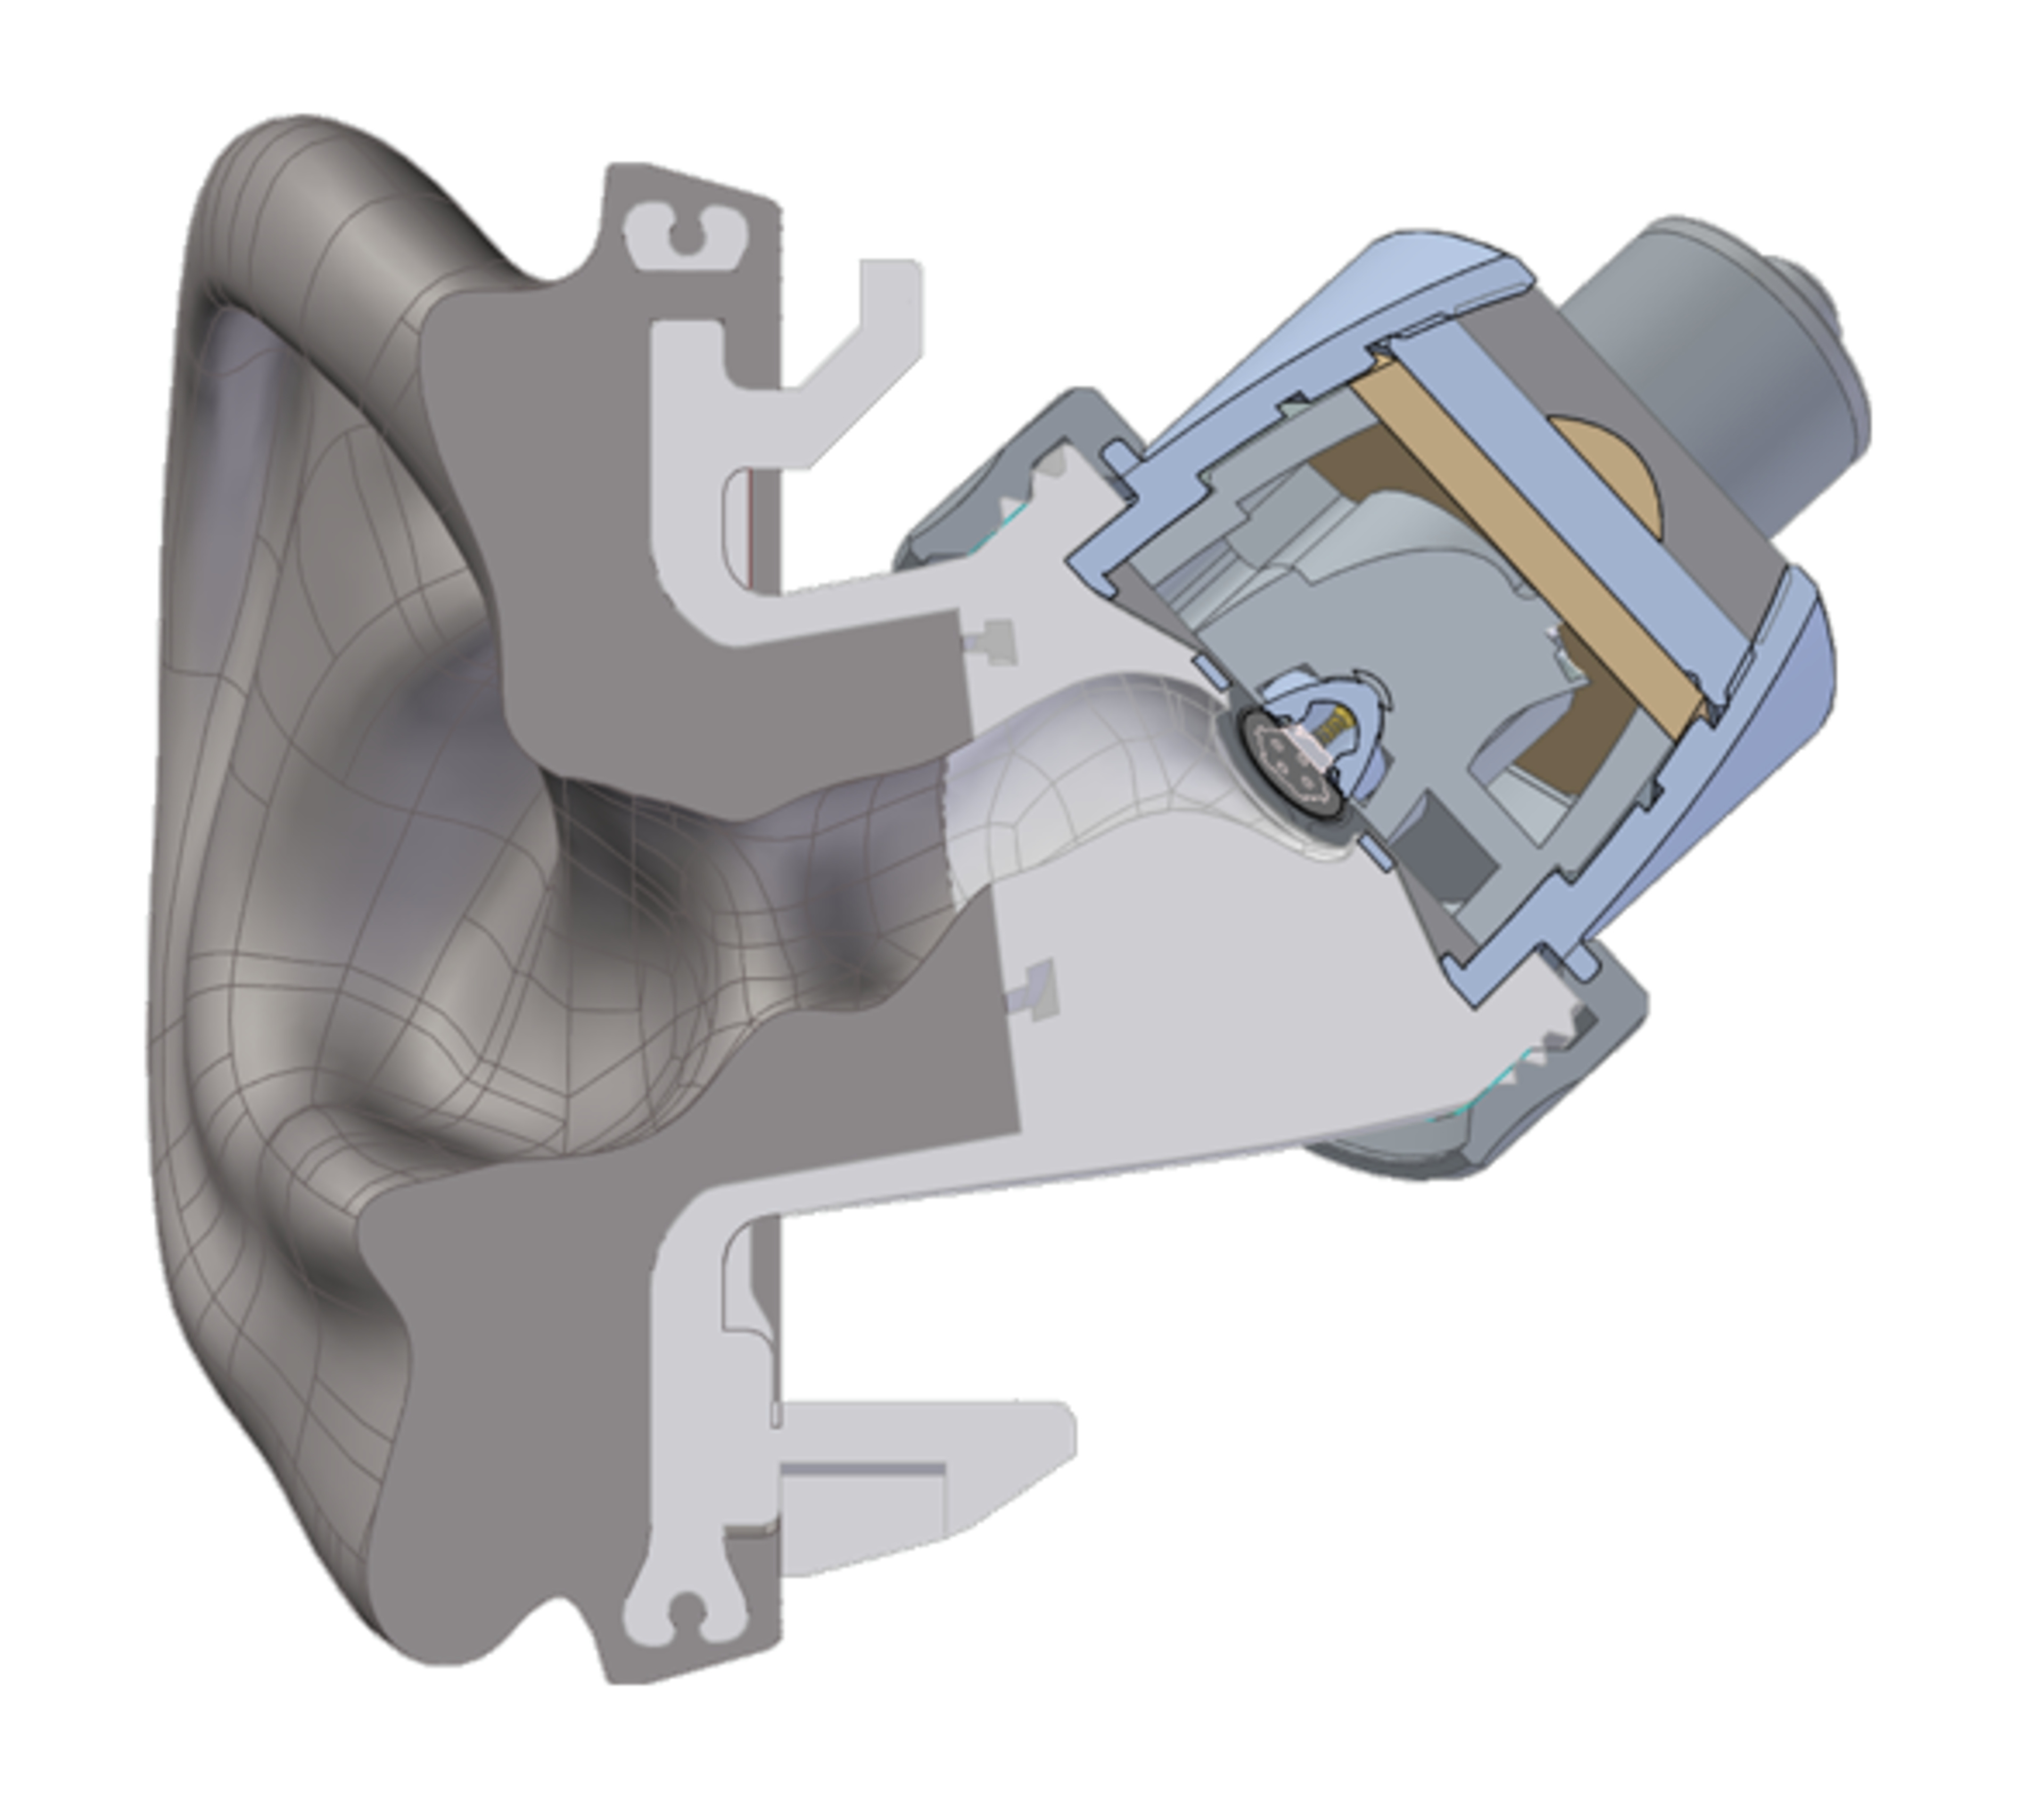
We use a Brüel & Kjær HATS Type 5128-B (B&K) measurement rig in a room with a low noise level and minimal sound treatment. Once the headphones are placed on our artificial head, that's when the magic begins. The testing levels are calibrated with a 500Hz test tone normalized for the selected headphones to generate 94 dB SPL. This is compliant with the IEC 60268-7 standardized headphone and earphone testing procedures, allowing us to validate our results with manufacturer specifications and other published frequency response graphs that comply with this widely accepted standard.
We then play a test signal (also called a stimulus) from our PC, which is generated by an Audio Precision APx517B Acoustic Analyzer. This signal is a two-second 20-20kHz log sweep at a constant level previously determined in the calibration sequence. The headphones reproduce this signal, and the audio is captured by the B&K's ear simulator (type 4620). This data is then fed back to the analyzer.
We smooth our plots and calculations at 1/12th octave since this amount of smoothing removes the very fine fluctuations in the frequency response that aren't perceptible to human hearing while preserving the details that are audible to humans. For Bluetooth headphones, we use the Bluetooth Duo module from Audio Precision to feed the wireless signal.
We don't take measurements just once, though! We also re-seat over/on-ear headphones five times and three times for in-ears. This movement helps us capture the small deviations in sound due to the natural variation of headphones' fit, positioning, and seal. Each time we move the headphones, we do another round of measurements. In our previous methodology, we used in-ear microphones worn by actual humans for on-ear and over-ear headphone measurements in the bass region. We now rely on the B&K HATS for the whole spectrum as it's a more standardized approach, and the ear simulator is fully specified to cover the full range of human hearing. The human measurements aren't completely gone but are now only used in the Frequency Response Consistency test.
Target Curve
If you're a seasoned audiophile, you may be able to read the raw frequency data alone and come to your own conclusions. If you need more guidance, you'll want to use a target curve. Target curves are representations of what most people consider 'good sound' based on research and data. There are many to pick from, including a number you can view on our Graph Tool, such as the Harman IEM target, the SoundGuys.com Headphone Preference Curve, and the SoundGuys.com Studio Curve.
Still, personal preference also plays a large role in whether you'll like a particular frequency response. There's no single good frequency response for headphones—we've even performed research showing that perception of what constitutes good sound varies with personal preference. If you enjoy a particular sound that doesn't match one of our target curves, that's absolutely fine and to be expected. There's no need to second-guess yourself. Nonetheless, comparing different headphones against our target curve might help you better understand your preferences. For instance, you might notice that you tend to prefer headphones with a little less treble than our curve, which will help you make buying decisions in the future.
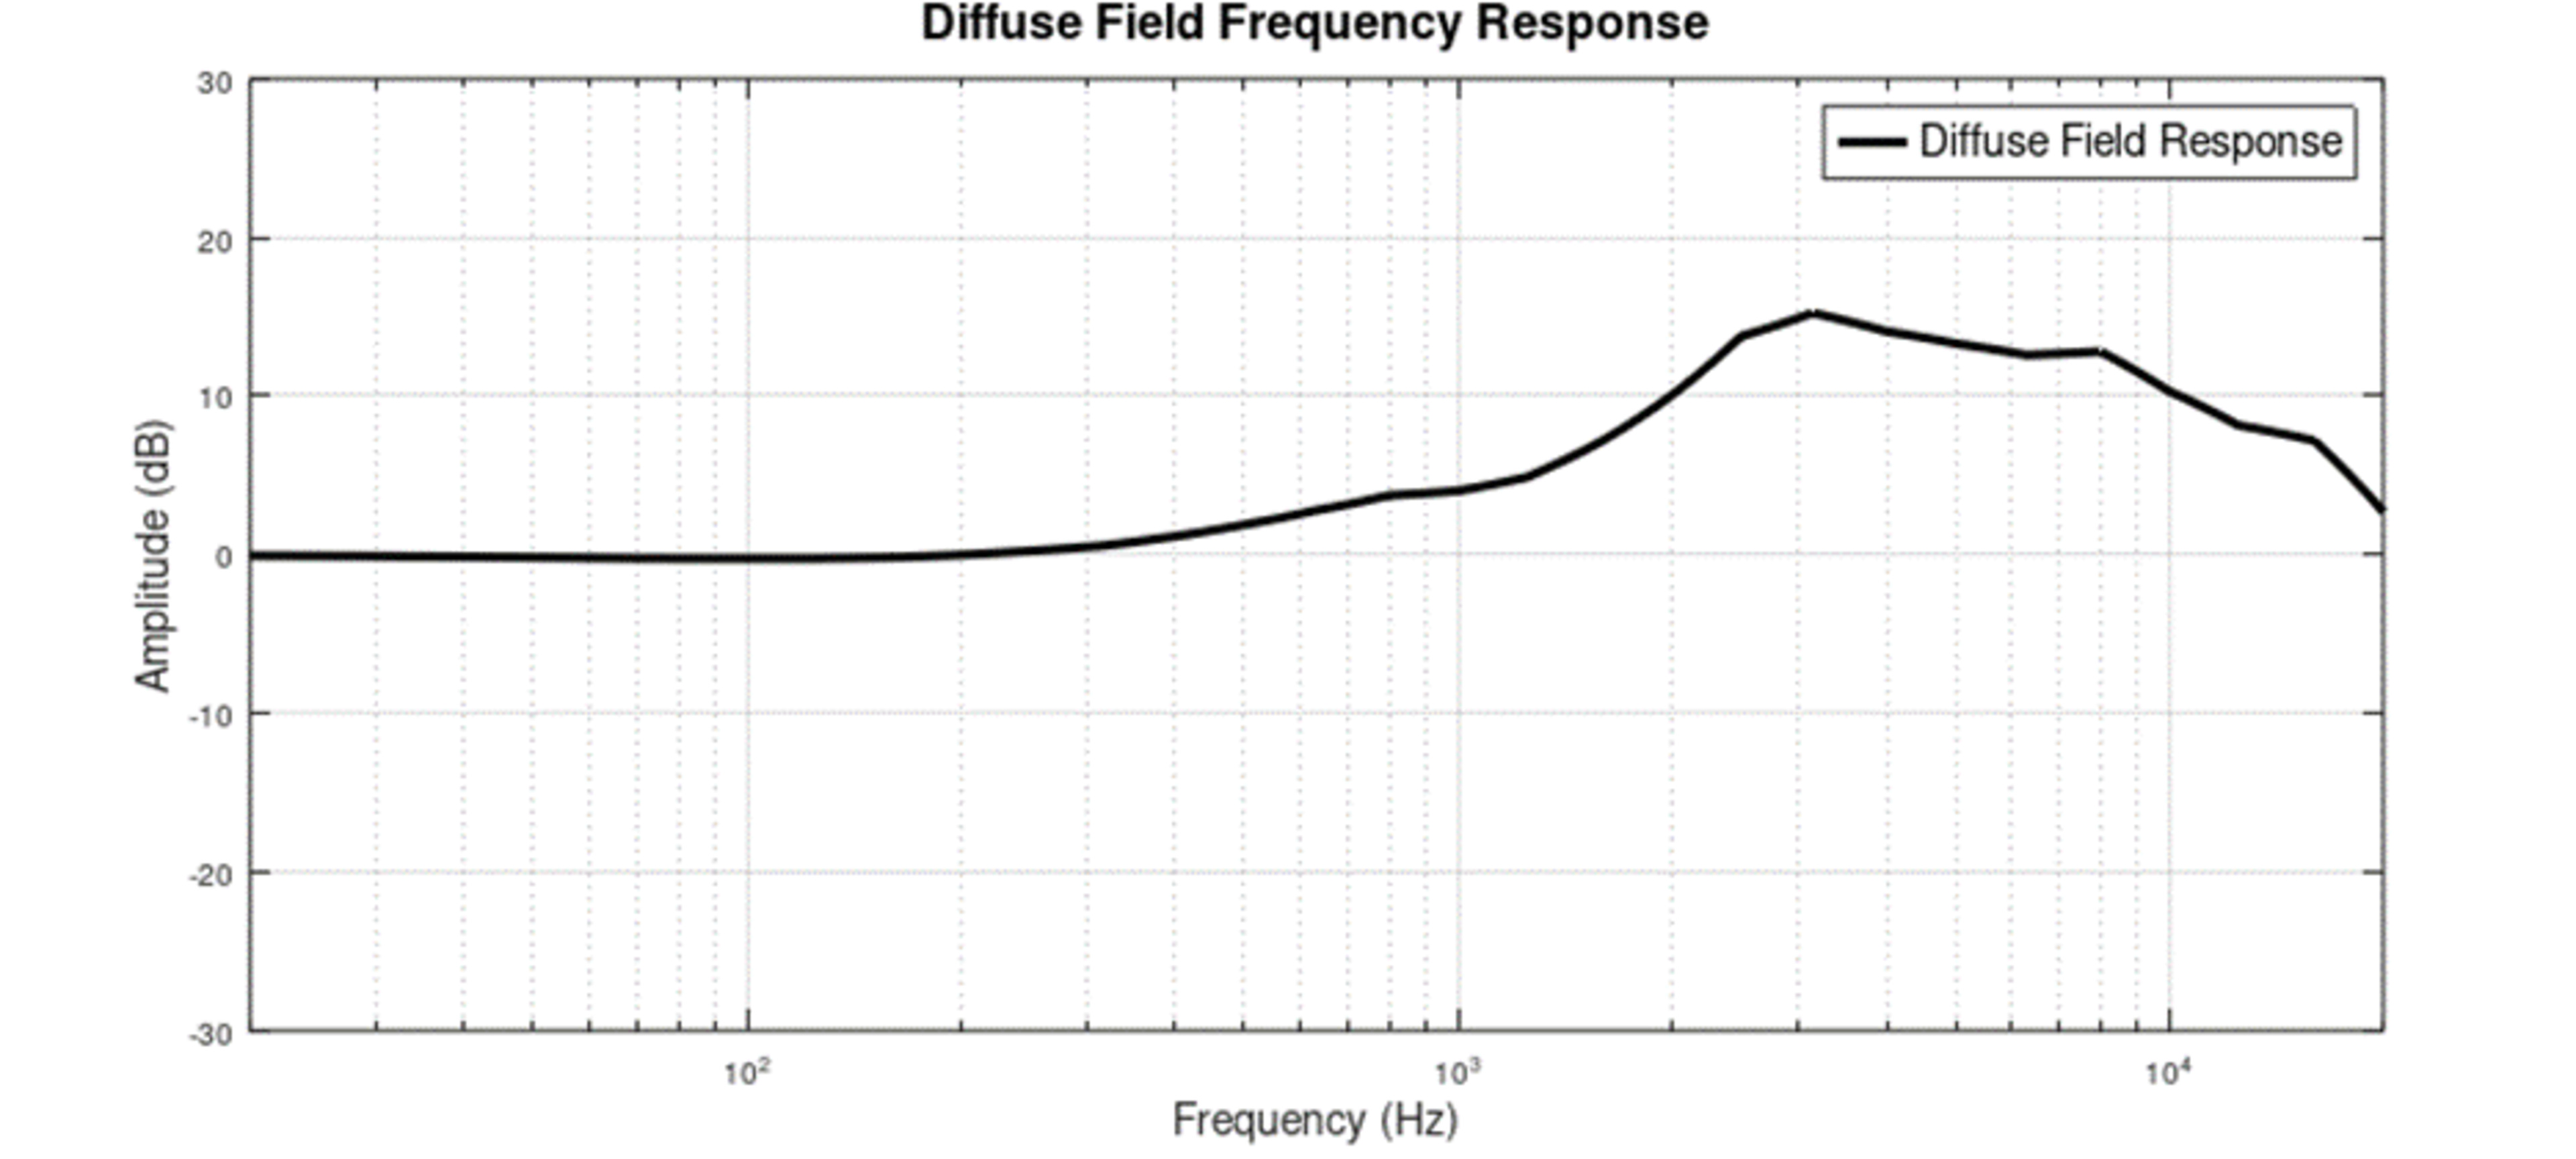
We use a target curve that's inspired and influenced by work done at Harman1,2,3, as well as other studies in the audio industry4. Their research is, in turn, derived from how sound reaches your ears when using good speakers in a semi-reflective room. Their targets have been instrumental in informing our own. That said, our test rig isn't the same one used by Harman—they use a GRAS rig, which doesn't behave quite the same as our Brüel & Kjær HATS Type 5128 (B&K). Both rigs produce similar, valid measurements, but differently, and ultimately, there isn't a way to directly reproduce their test conditions and in-room response to our scenario.
We've updated our curve based on the diffuse field response of our B&K rig. From there, we added a 6 dB downward tilt based on our speaker target and added a 4.3 dB bass shelf at 105Hz (Q. 0.707) to achieve a target response that aligns with Harman's studies without being a direct conversion. Their headphones research shows a significant variance in listener preference, including the bass amount. A majority of listeners prefer Harman's target level in this range. In our own listening tests, we also noticed a preference for bass boost, so we want to reflect this in our own target curve.
The target response is then smoothed to 1/6th octave to reflect the fact that a target curve is about general tonality and not small frequency deviations. Our target curve philosophy is rooted in preference variability; small peaks and dips in any given response ultimately fall within preference bounds, so reducing their presence won't significantly impact your own assessment of sound quality.
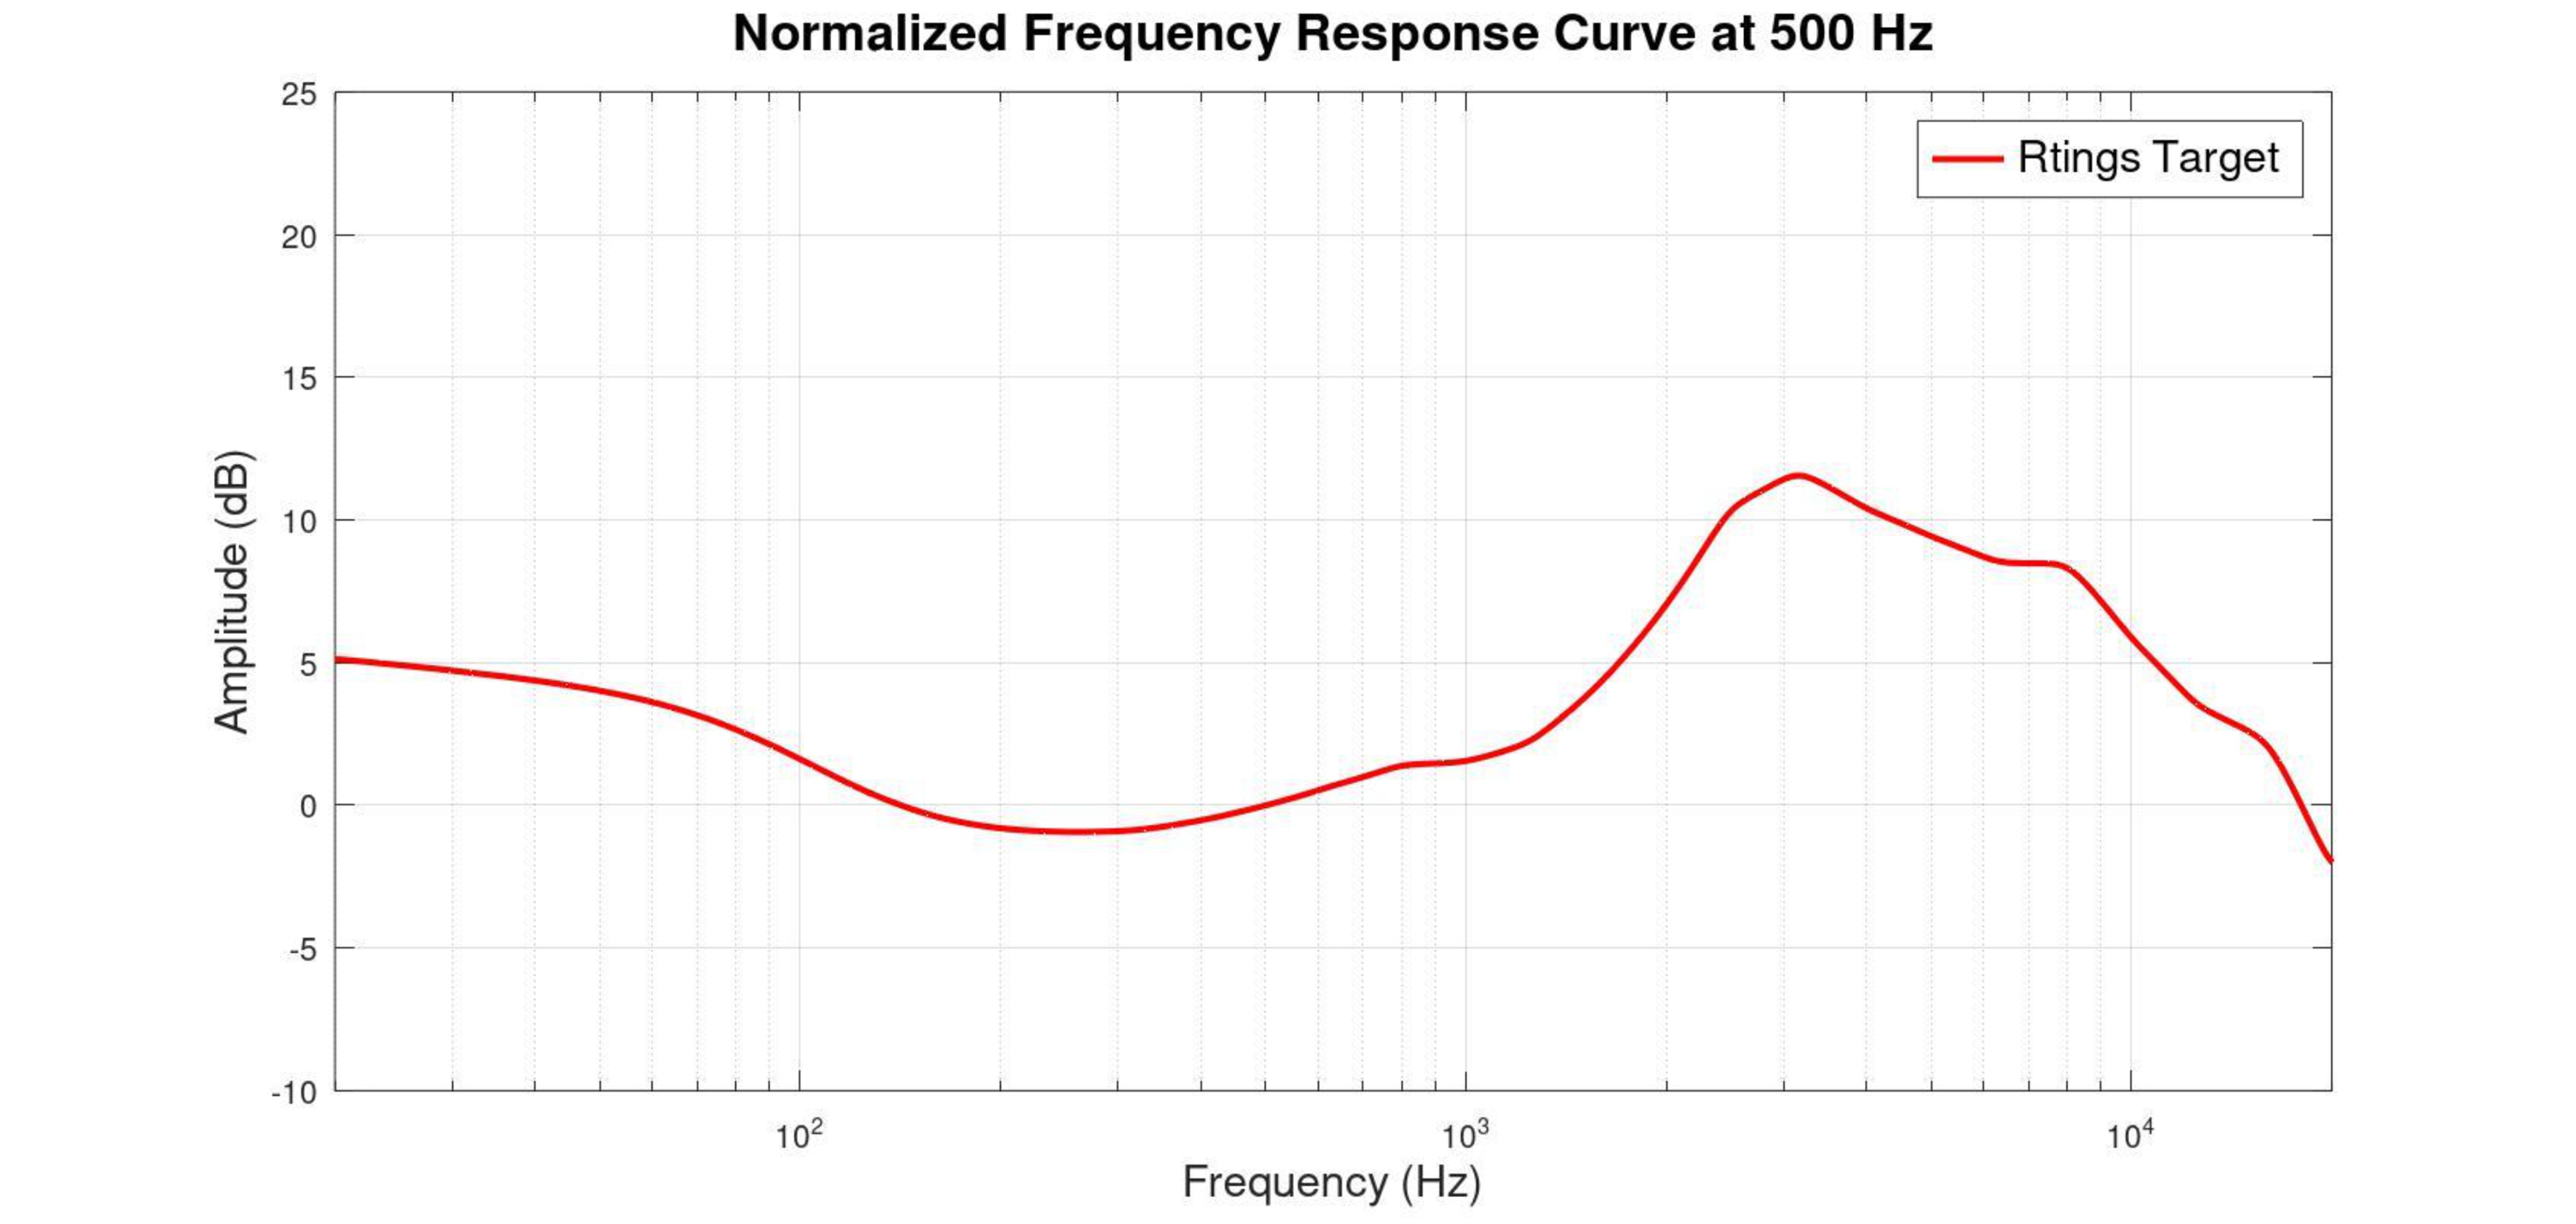
So, there you have it: our target curve. This target is the same for all headphones; in the past, we had separate IEM and over/on-ear targets, but we've simplified them into one target. It isn't fully understood yet why IEMs tend to show more differences in bass response between different setups, i.e., between IEC 711 couplers (like you'll find in rigs like GRAS and HMS II.3) and type 4620 ear simulators (including our B&K rig).
 |  |
A standardized target curve has its limitations, though. While our own target reflects a sound most people will like, at the same time, it's not an absolute measure of what sounds 'correct'. Importantly, deviations from any of the target curves we've made available in our Graph Tool are not necessarily bad either. First, the curves are averages; it's expected that headphones will deviate from any curve by a couple of dBs here and there. Second, manufacturers have their own aims and target markets, which means many deviations are intentional. For instance, many of Beyerdynamic's headphones are fairly bright, such as the Beyerdynamic DT 990 PRO. But they're popular among audio engineers as that sound signature can make identifying clicks and pops a little easier. Finally, as we mentioned above, your personal preferences play a big role in understanding what's right for you; a target curve is just one tool to help you make that decision more confidently.
You'll want to check out our R&D article for more details on our target curve. In it, you'll discover how we came to our target curve, our research (including a listening test!), and observations related to the general state of measurements versus preference. And if you're looking for an overview of how we test headphones, check out our article on transforming data into objective reviews.
Conclusion
Raw frequency response is a large part of how a pair of headphones sounds. Once you've cracked the graph, it's an invaluable tool to understand whether something may sound good for your needs. However, it's only part of the puzzle. If you want to understand how people talk about frequency response, you'll also want to check out our sound quality glossary.
Recent Updates
- 06-03-2025: We updated this article to align with changes made as part of Headphones Test Bench 2.0.