- Table of Contents
- Intro
- When It Matters
- Our Tests
- Conclusion
- Comments
Our Sound Profile Scores and Tests
Headphones
When buying a pair of headphones, it's important to find ones that sound the way you like. But how can you know what they sound like without listening to them? You can look at their raw frequency response, which tells you how accurately the drivers reproduce each frequency in amplitude. However, if you're just learning to read sound graphs, it can be challenging to interpret this information. Our Sound Profile test is designed to simplify this process.
Although we don't score this test, if you want to know how well the frequency response follows our target curve, you'll want to check out the following articles:
- Bass Profile: Target Compliance
- Mid-Range Profile: Target Compliance
- Treble Profile: Target Compliance
If you want to understand audio quality terminology, look at our sound quality glossary, too.
Test results
When It Matters
Our Sound Profile test is a more novice-friendly sibling of Raw Frequency Response. This test makes it easier to see how the frequency response deviates in relation to our target curve. Target curves are representations of what most people consider 'good sound' based on research and data. While there are a few out there, in our own case, we use a target inspired by research conducted by Harman1,2,3 and informed by other studies in the audio industry4. These works are based on how sound reaches your ears when using good speakers in a semi-reflective room. If you want to get into the details of our target curve, you'll want to check our R&D article, which further explores our process of defining our target curve and the pitfalls therein. We'll keep things a little more surface-level for the rest of the article.
Our target curve can be a good start for finding a sound that suits your needs. It isn't the be-all, end-all of 'quality' sound, though. There's a lot of variation in user preferences, and you may even prefer a sound that's different from our own target. However, using it comes with a couple of benefits. For one, we use the same target for all headphones we test, making it easy to compare different headphones. And, as you'll see below, tests like bass and treble amount (which are formulated by calculating the deviation from our target) can further help you identify a sound you may prefer.
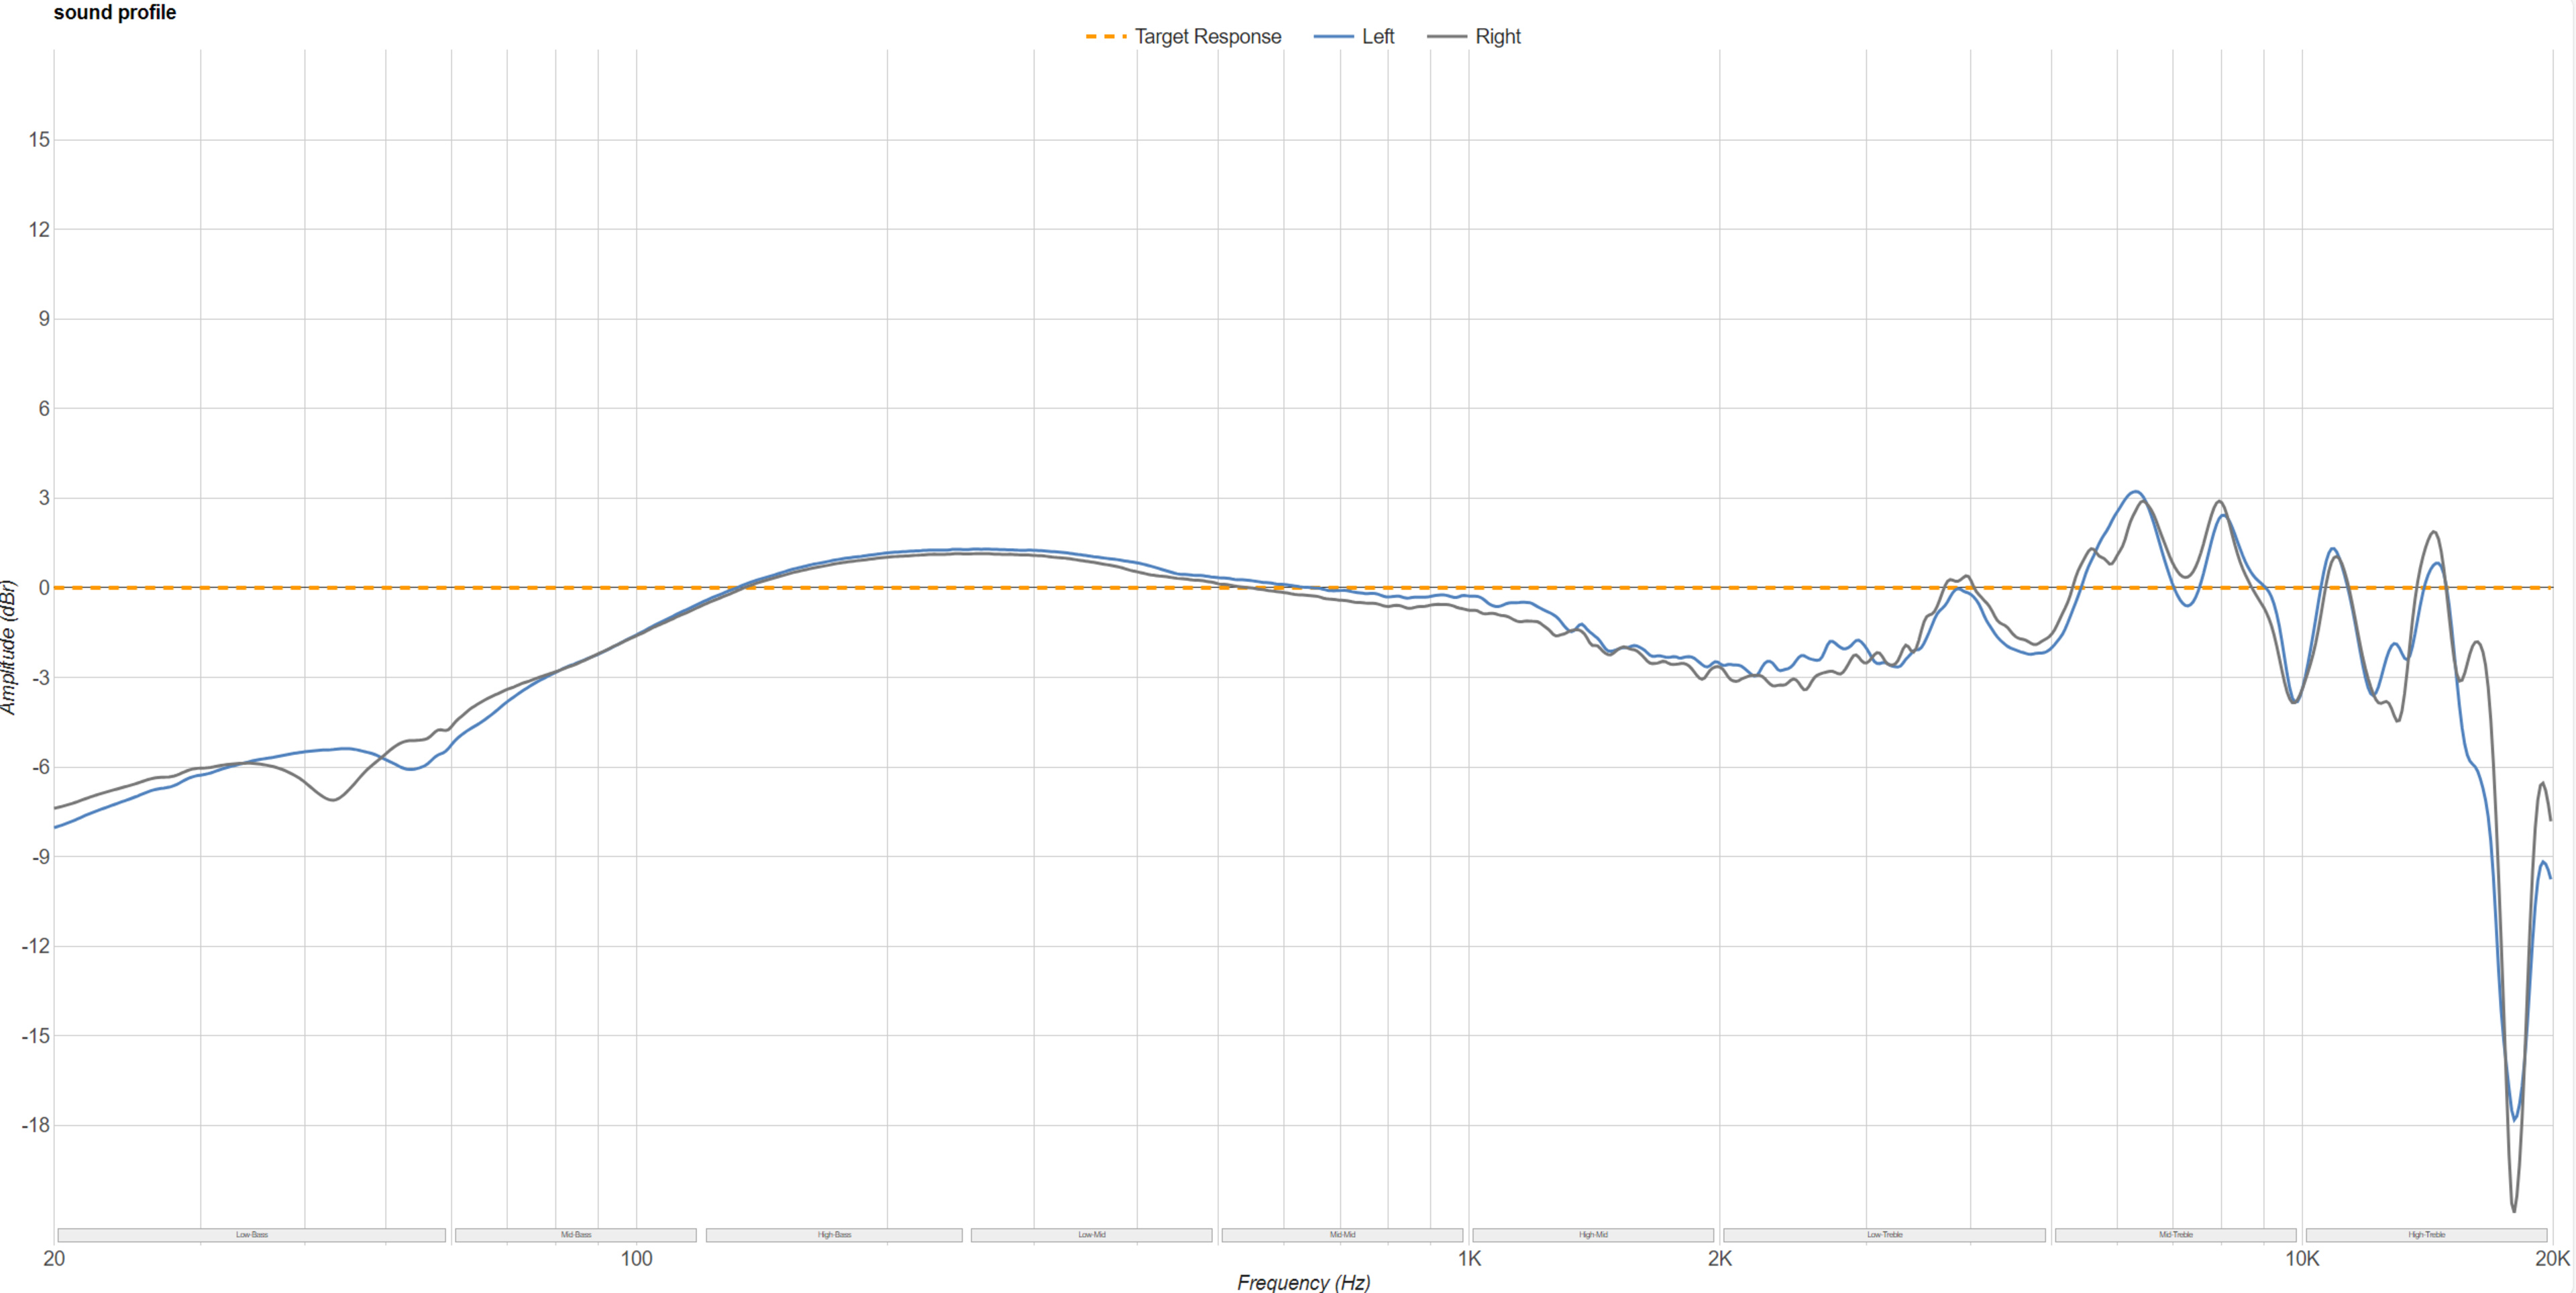
The multi-curve graphing tool added with Test Bench 2.0 now introduces the ability to compensate a response to a variety of targets. You'll notice that if you click on the Sound Profile, Raw FR, or Bass, Mid, and Treble compliance graphs to enlarge them, you can now view comparisons with other target curves validated on the B&K Type 5128 HATS. These include the Harman IEM target, the SoundGuys.com headphone target response curve, the SoundGuys.com studio curve, the SenseLab/Aizu target, and a diffuse field response, among others.

Our Tests
Testing Procedure
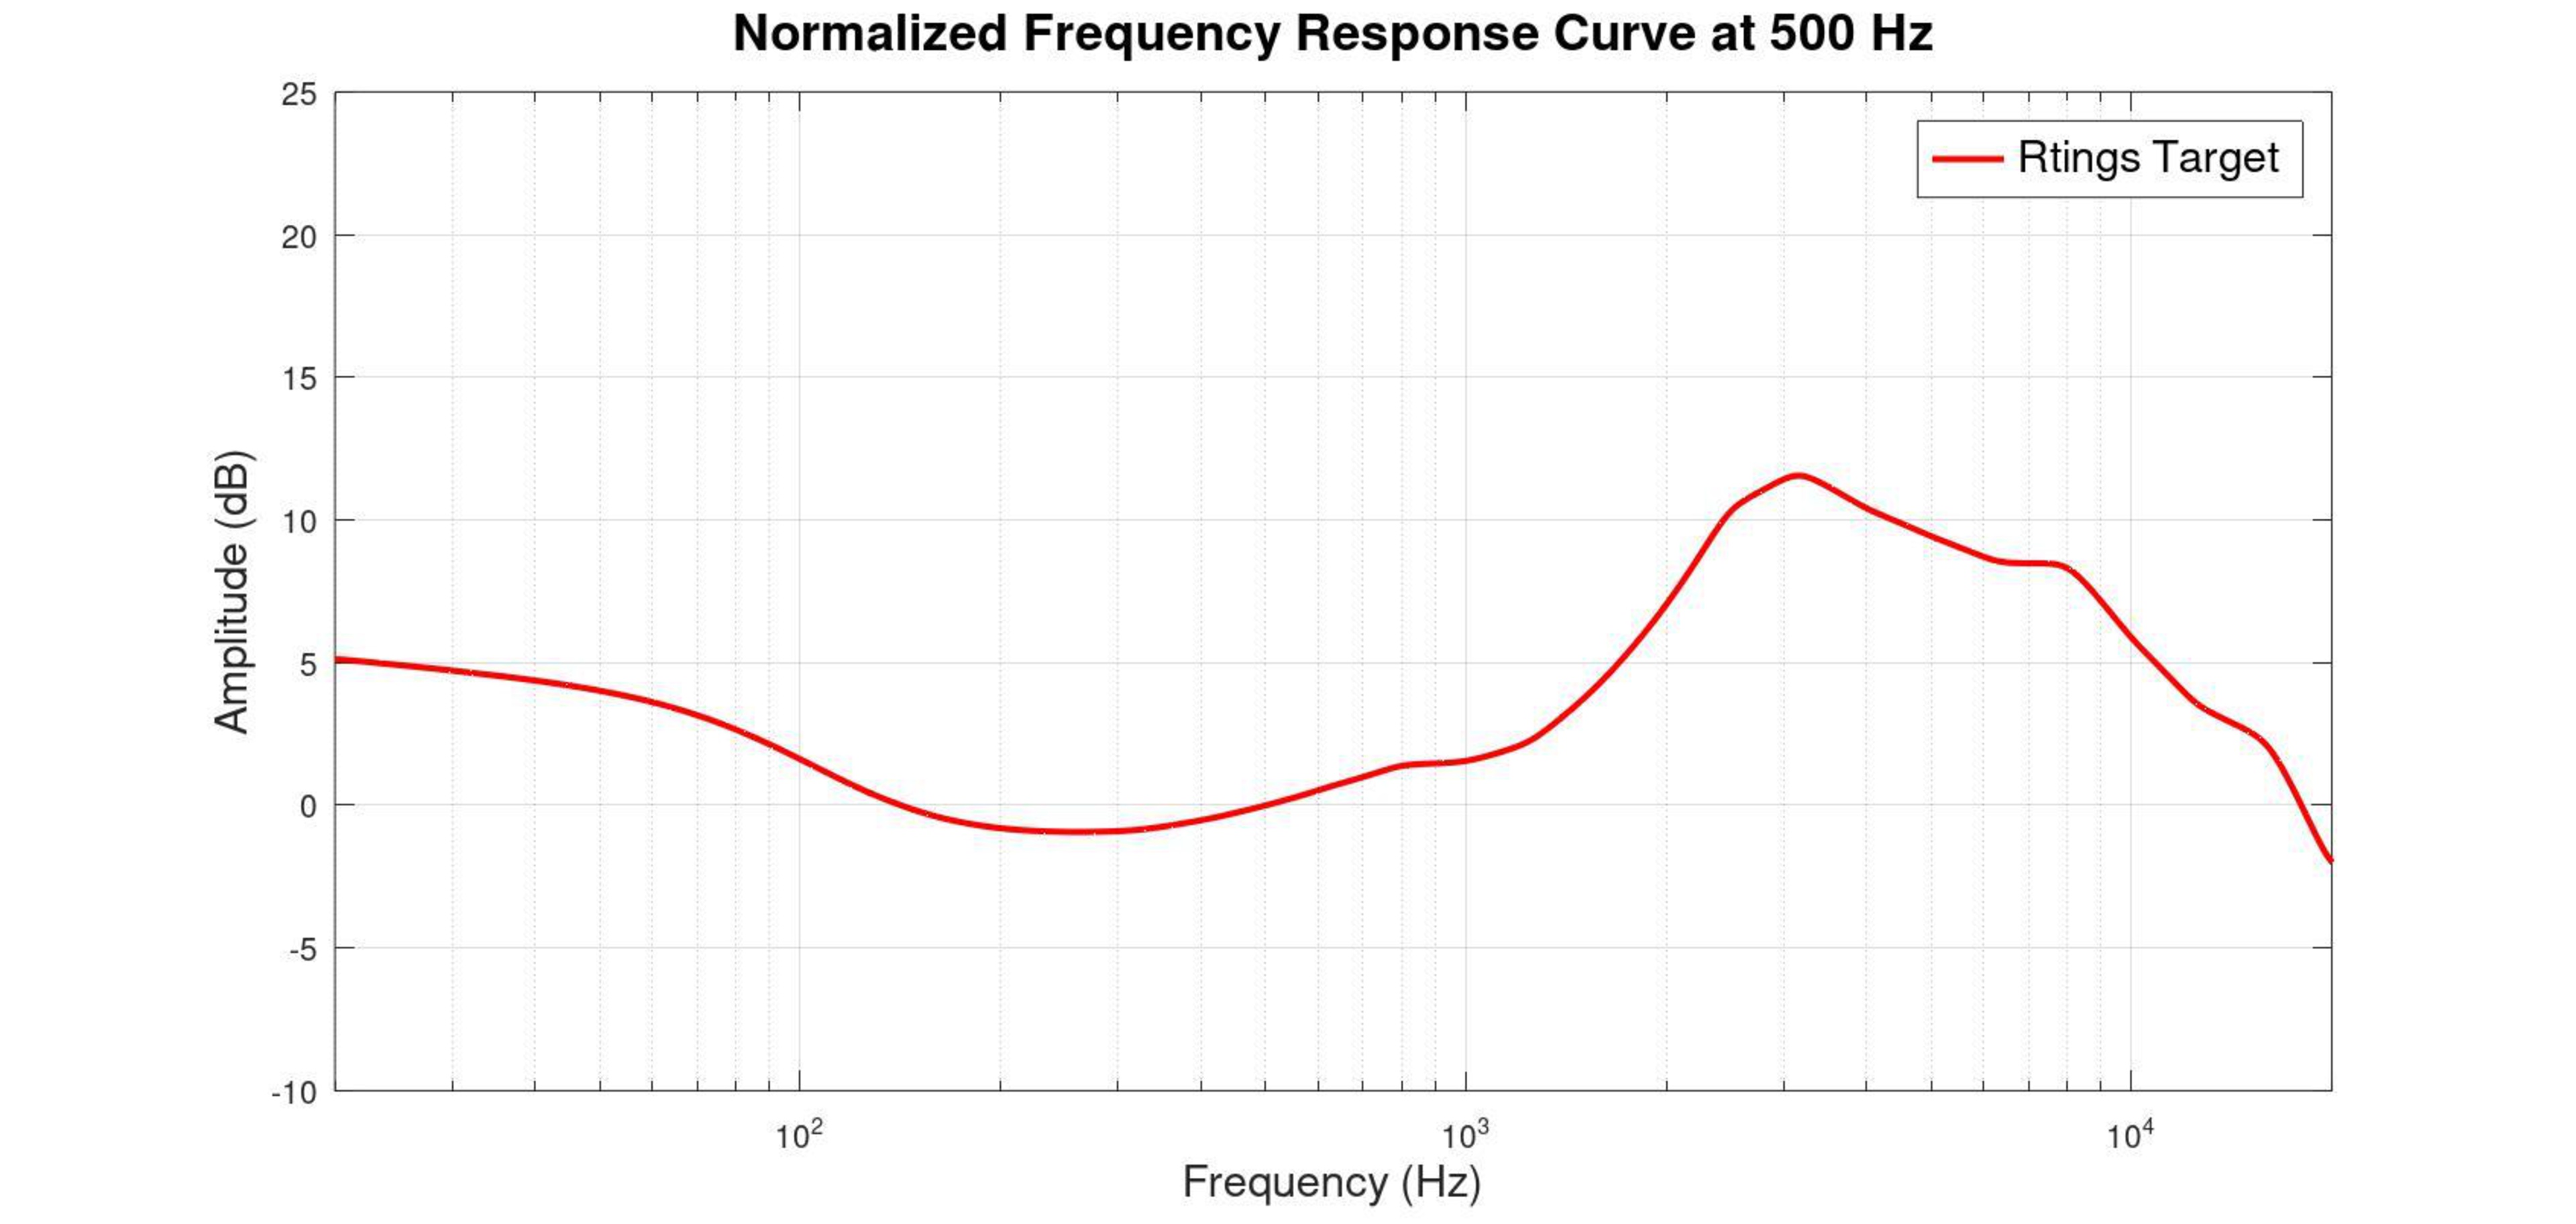
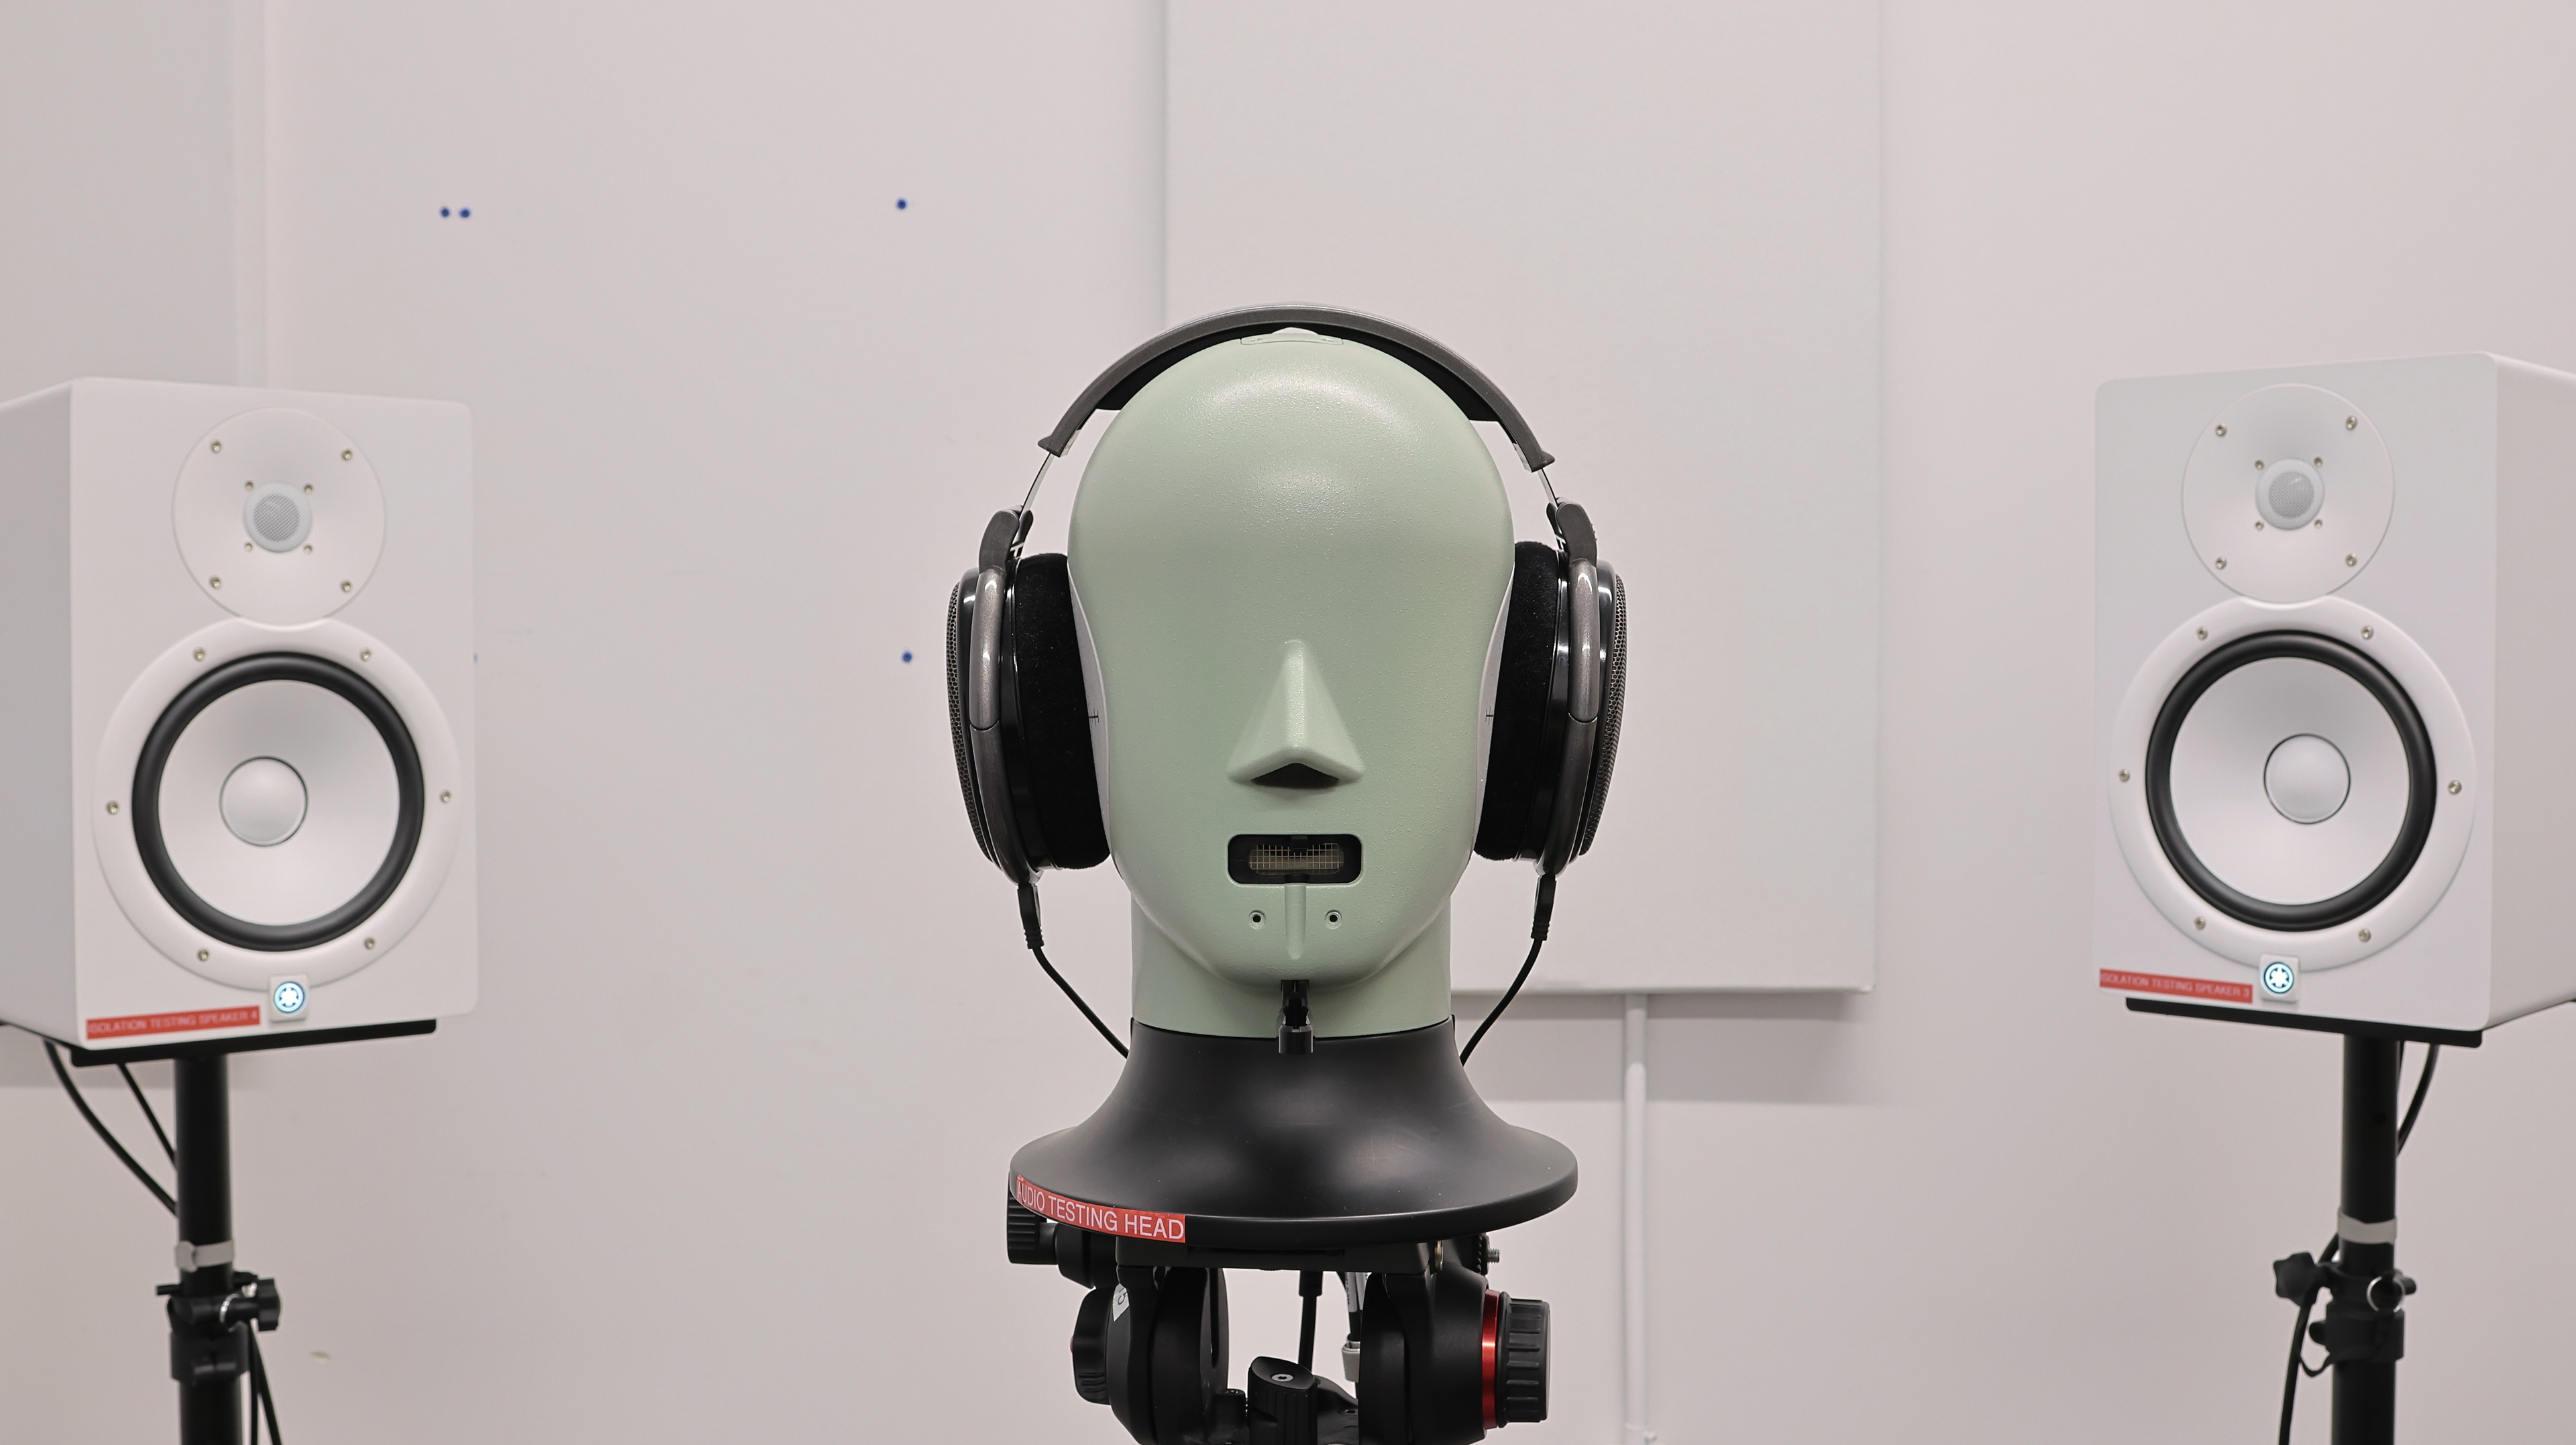
To create our sound profile graph, we must first measure the raw frequency response. We use a Brüel & Kjær HATS Type 5128-B (B&K) measurement rig in a room with low ambient noise and minimal sound treatment. We position the headphones on our artificial head and calibrate the testing levels using a 500Hz test tone, which is adjusted to produce 94 dB SPL for the specific headphone model in testing. This calibration adheres to the IEC 60268-7 standard for headphone and earphone testing, ensuring that our results are consistent with manufacturer specifications and other published frequency response graphs that follow this standard.
Next, we play a test signal—a two-second, 20-20kHz log sweep—using an Audio Precision APx517B Acoustic Analyzer. The signal is presented at a constant level set during the calibration. The headphones reproduce this signal, the audio is captured by the B&K ear simulator (type 4620), and the collected data is then sent back to the analyzer.
We smooth our plots and calculations at 1/12th octave, which filters out minor fluctuations in the frequency response that are inaudible to the human ear while still preserving perceptible details. For Bluetooth headphones, we use the Audio Precision Bluetooth Duo module to handle the wireless signal.
We also re-seat over-ear and on-ear headphones five times and in-ear headphones three times to account for slight changes in sound due to variations in fit, positioning, and seal. Each adjustment involves a new set of measurements. In test benches previous to v1.8, we used in-ear microphones worn by human subjects to measure the bass response of on-ear and over-ear headphones, but now we rely on our B&K for comprehensive frequency response measurements. This approach is more standardized and ensures that the ear simulator covers the full range of human hearing. Human measurements are now only used for the Frequency Response Consistency test.
Normalization Frequency
With the raw frequency response measured, all we need to do now is apply our target curve to this response and flatten our curve into a straight line, making it easier to see the sound of the headphones that are under or overemphasized compared to our target. We now mention the frequency at which the frequency response is normalized to match the amplitude of our target curve.
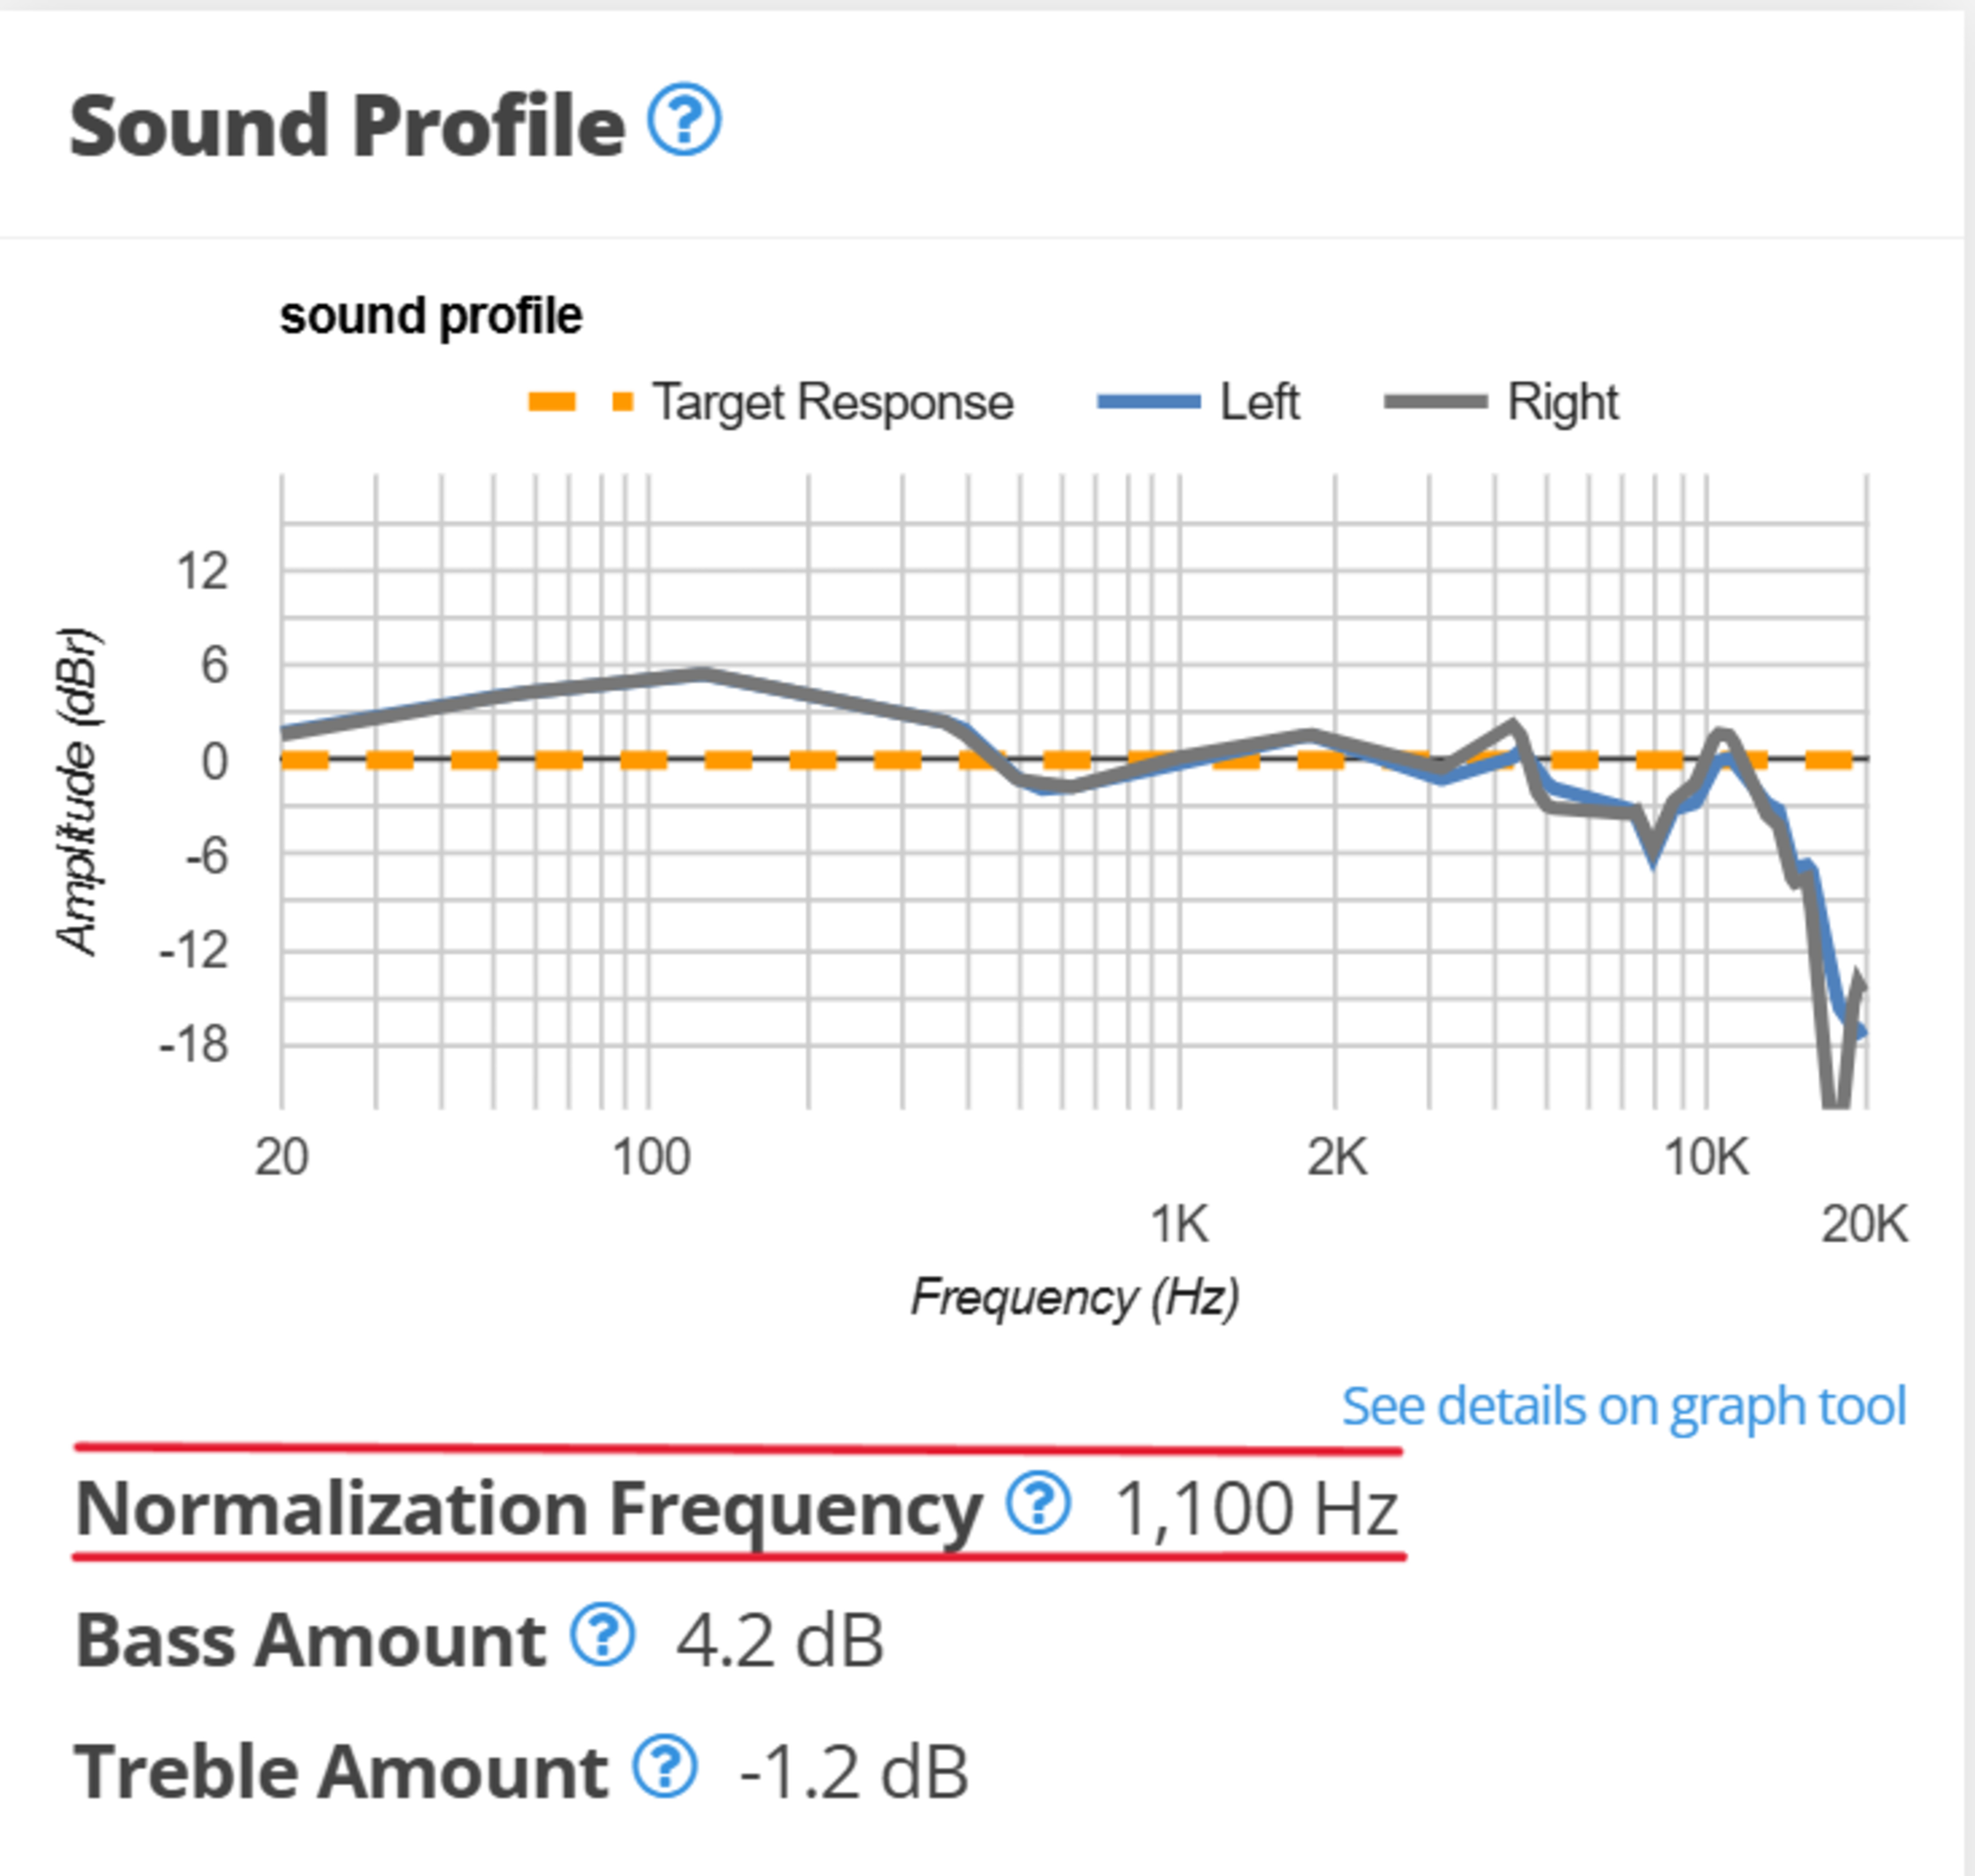
This frequency is selected to minimize the deviation between the response and our target in the mid-range. You'll want headphones with big peaks throughout the bass range if you prefer more thump, rumble, and boom in your audio. Conversely, if you like vocals and instruments to sound clear and natural, you'll want to look for a flatter response across the range.
Bass Amount
Bass Amount is the amount of deviation between the bass range frequency response and our target curve. In other words, this value will tell you how much bass a pair of headphones produces compared to our target curve. You'll want to look for positive values if you prefer a thumpier, punchier bass than our target. Enjoy less bass? Then a negative amount may be to your liking.
 | 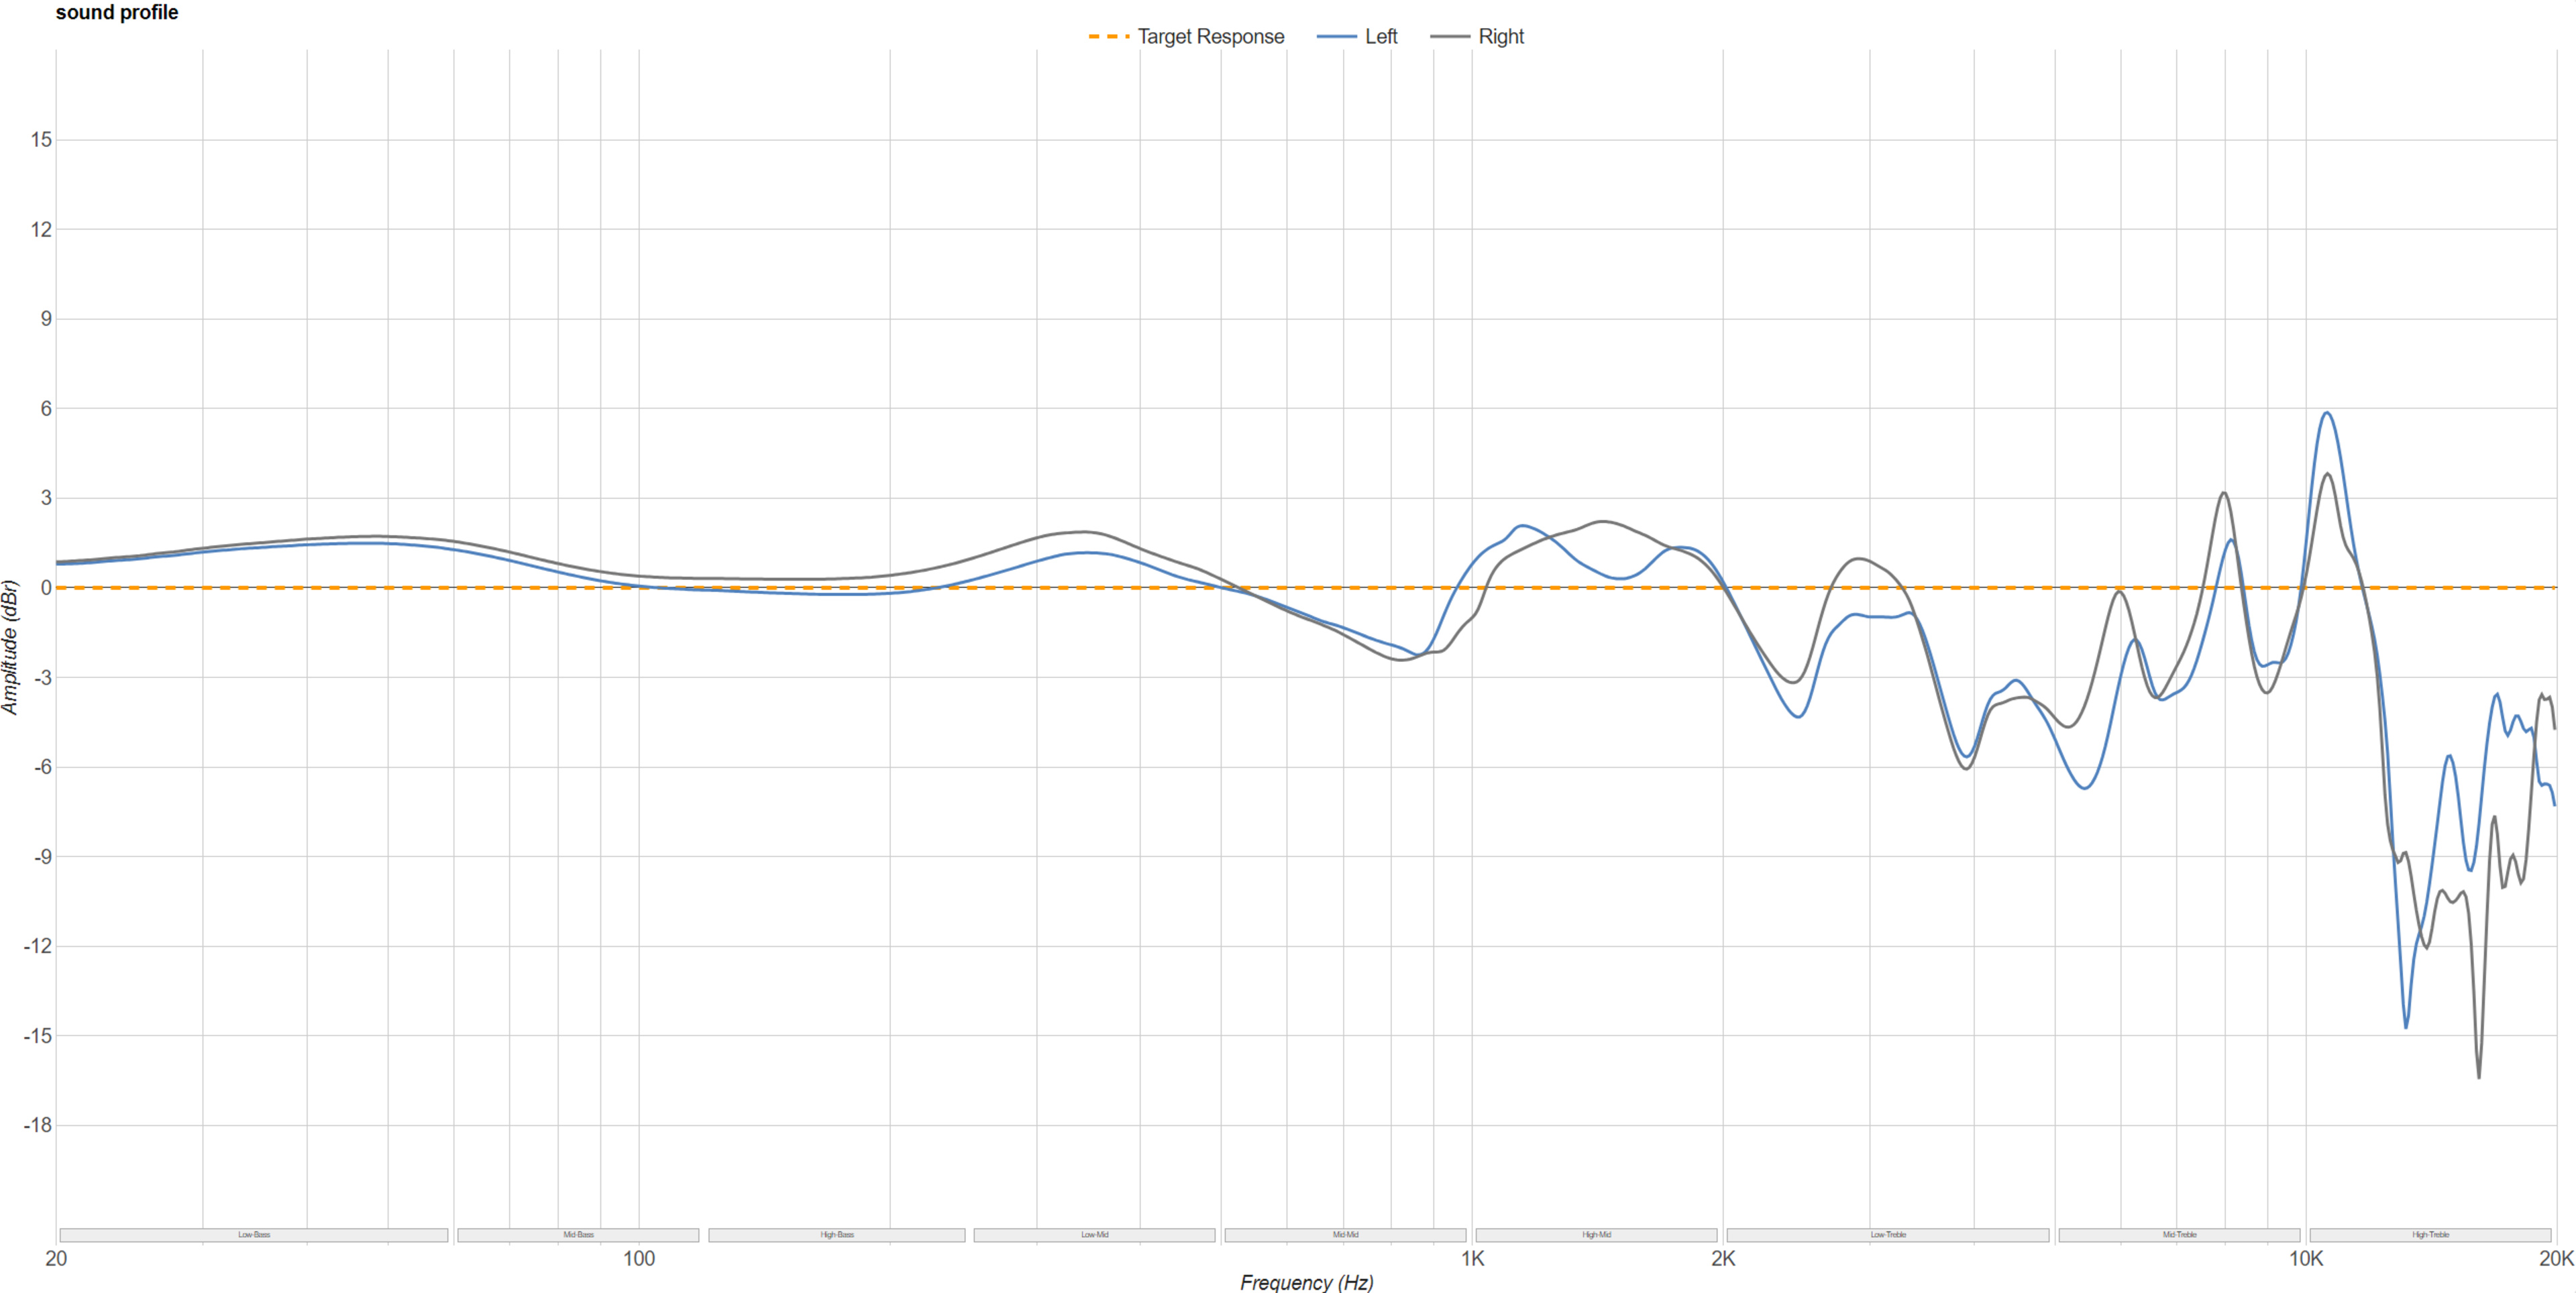 | 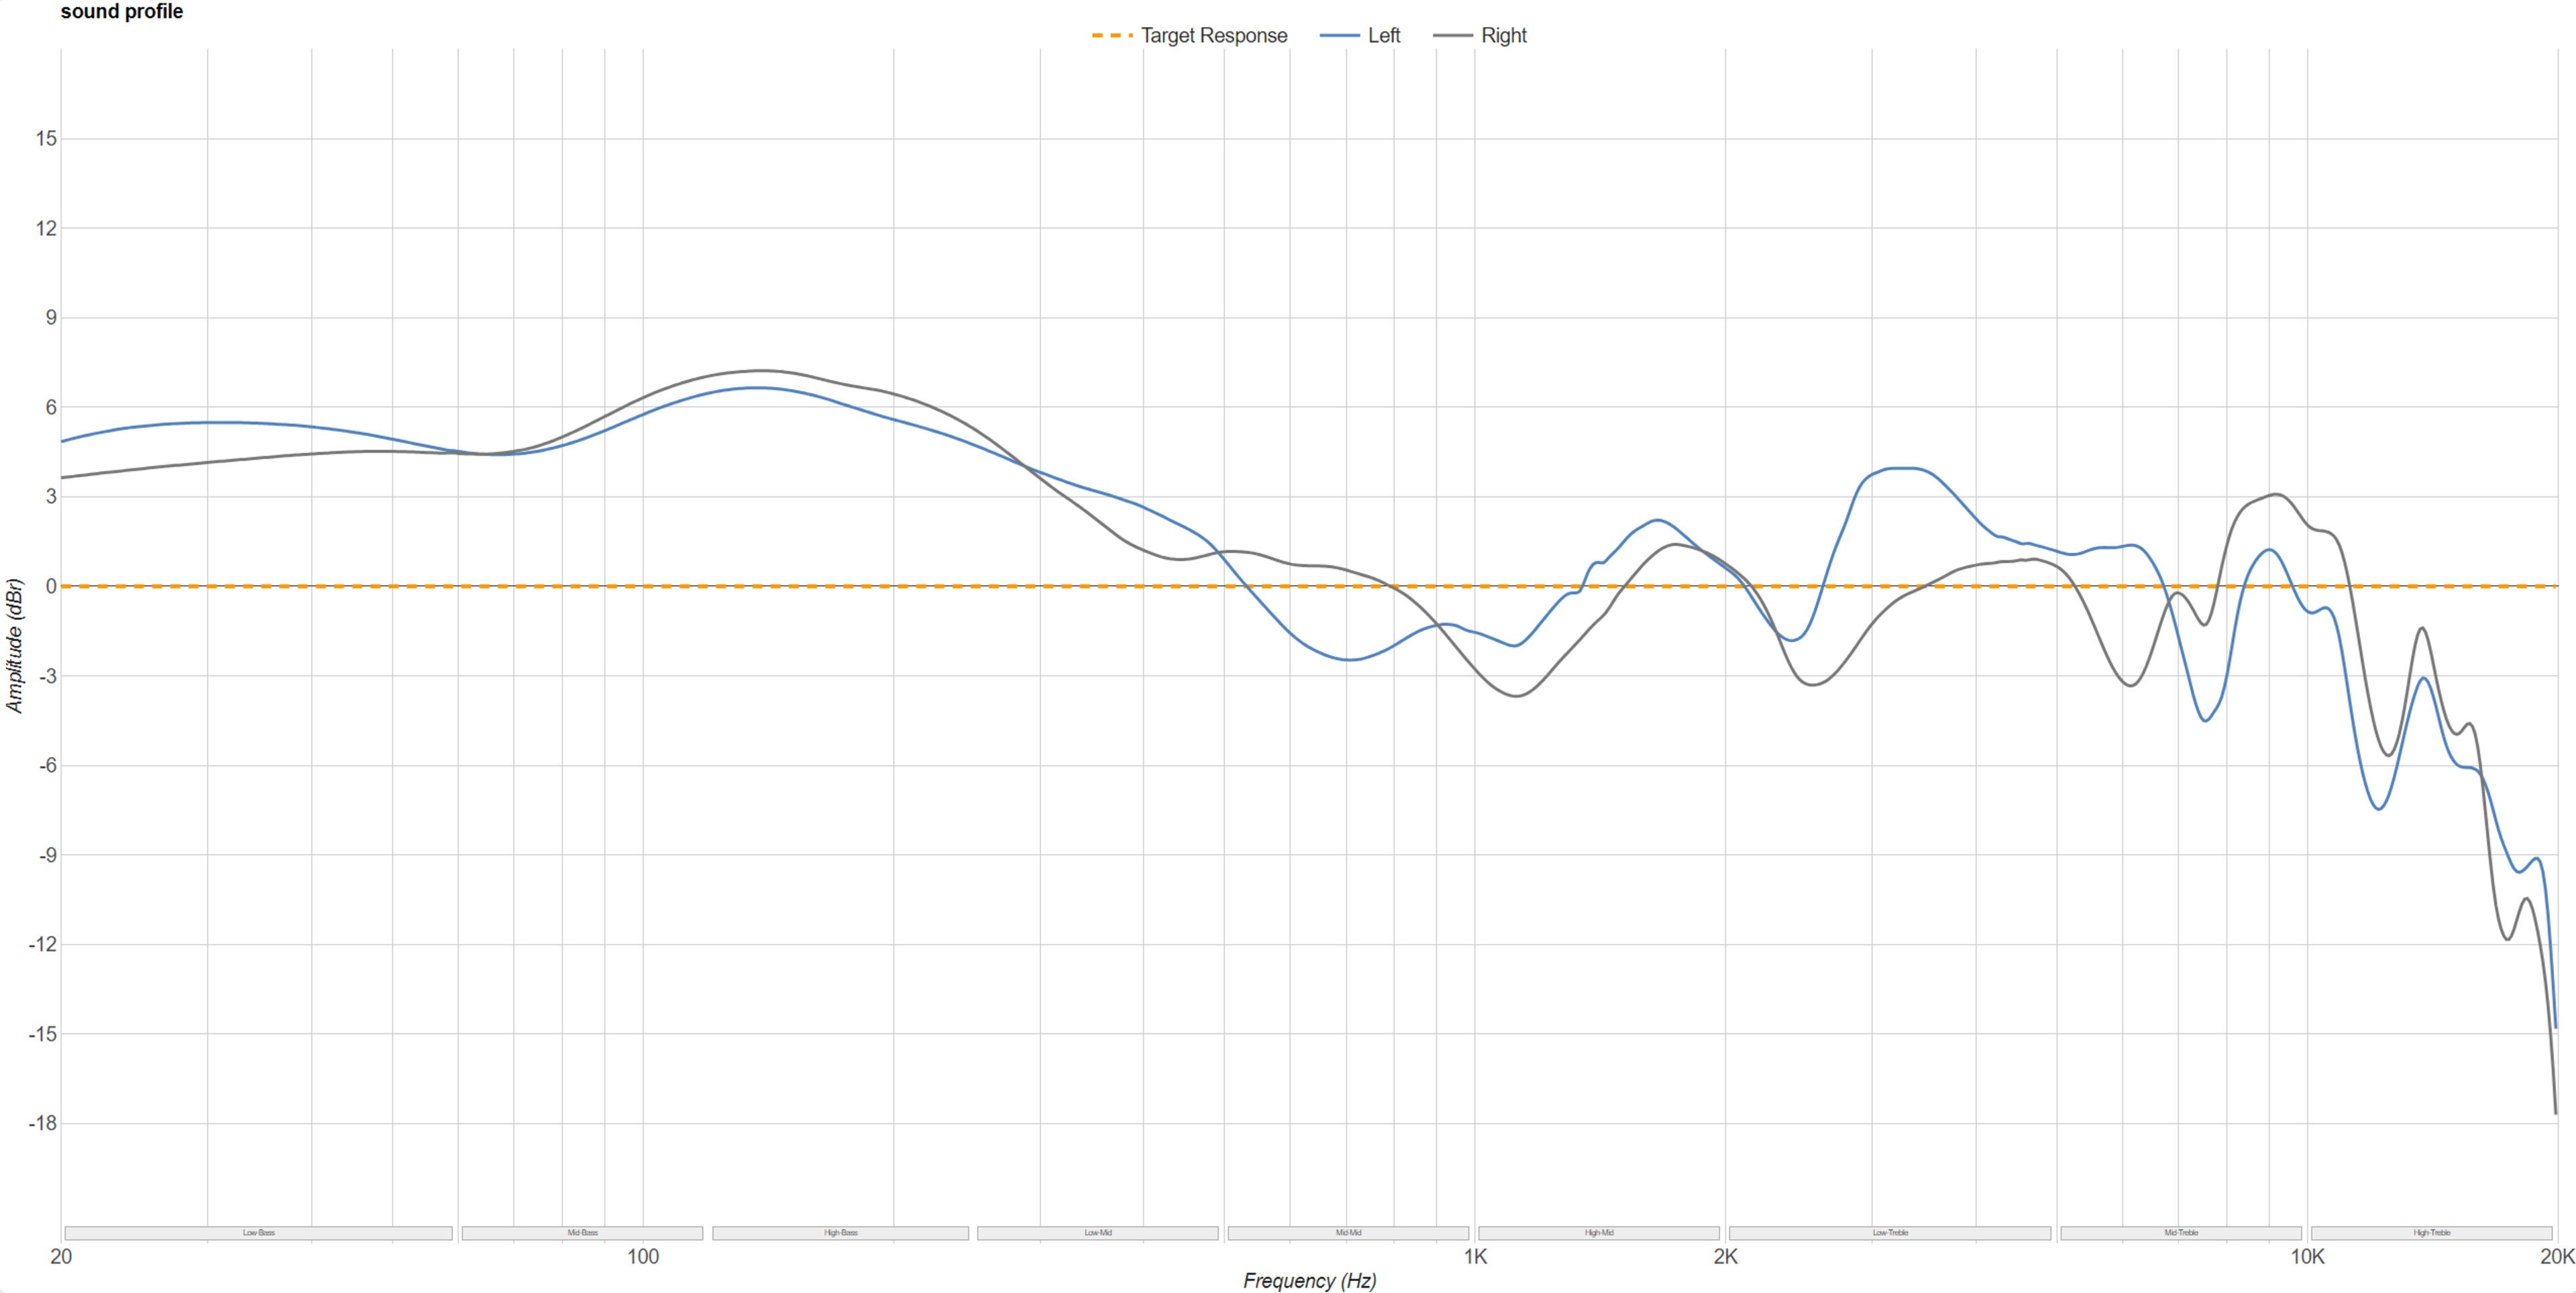 |
| Bass Amount: -3.2 dB | Bass Amount: 1.8 dB | Bass Amount: 5.6 dB |
This test isn't scored, and these values aren't an indicator of 'good' or 'bad' bass. That's where your personal preferences come into play. However, you can use these values to sort through our table or comparison tools to better see the differences between headphones in this range.
Treble Amount
Treble Amount is the amount of deviation between the treble range frequency response and our target curve. It'll tell you how much treble a pair of headphones produces compared to our target curve. A positive amount can result in a brighter sound. Conversely, a negative amount may result in a warm sound.
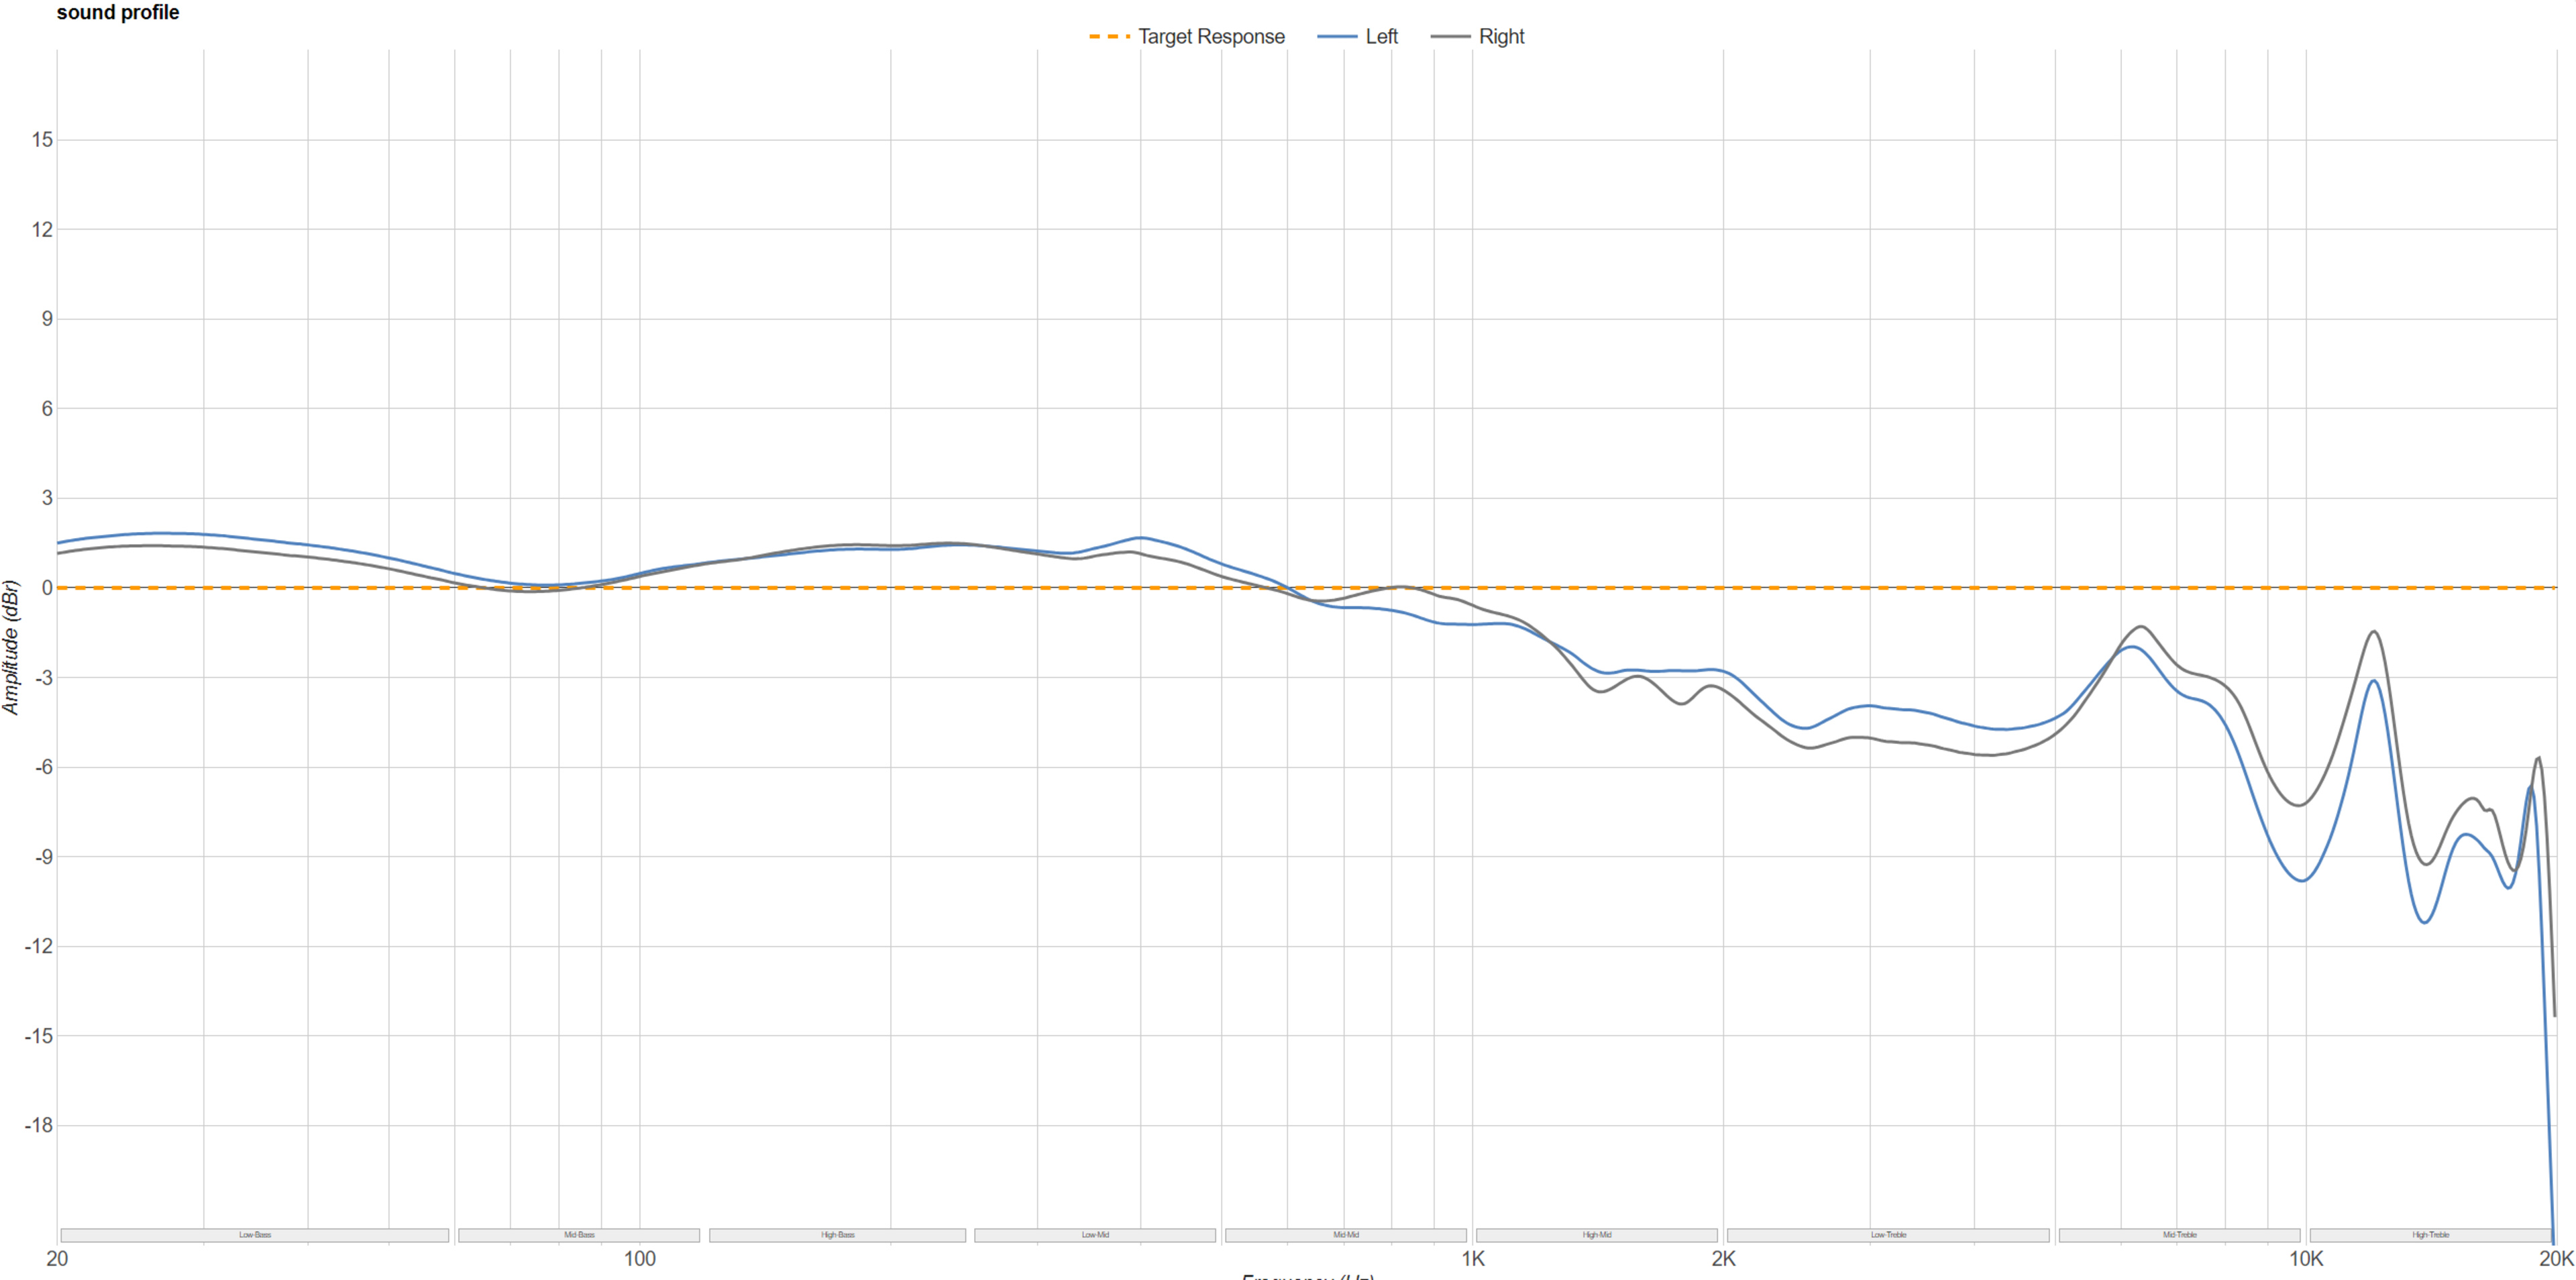 | 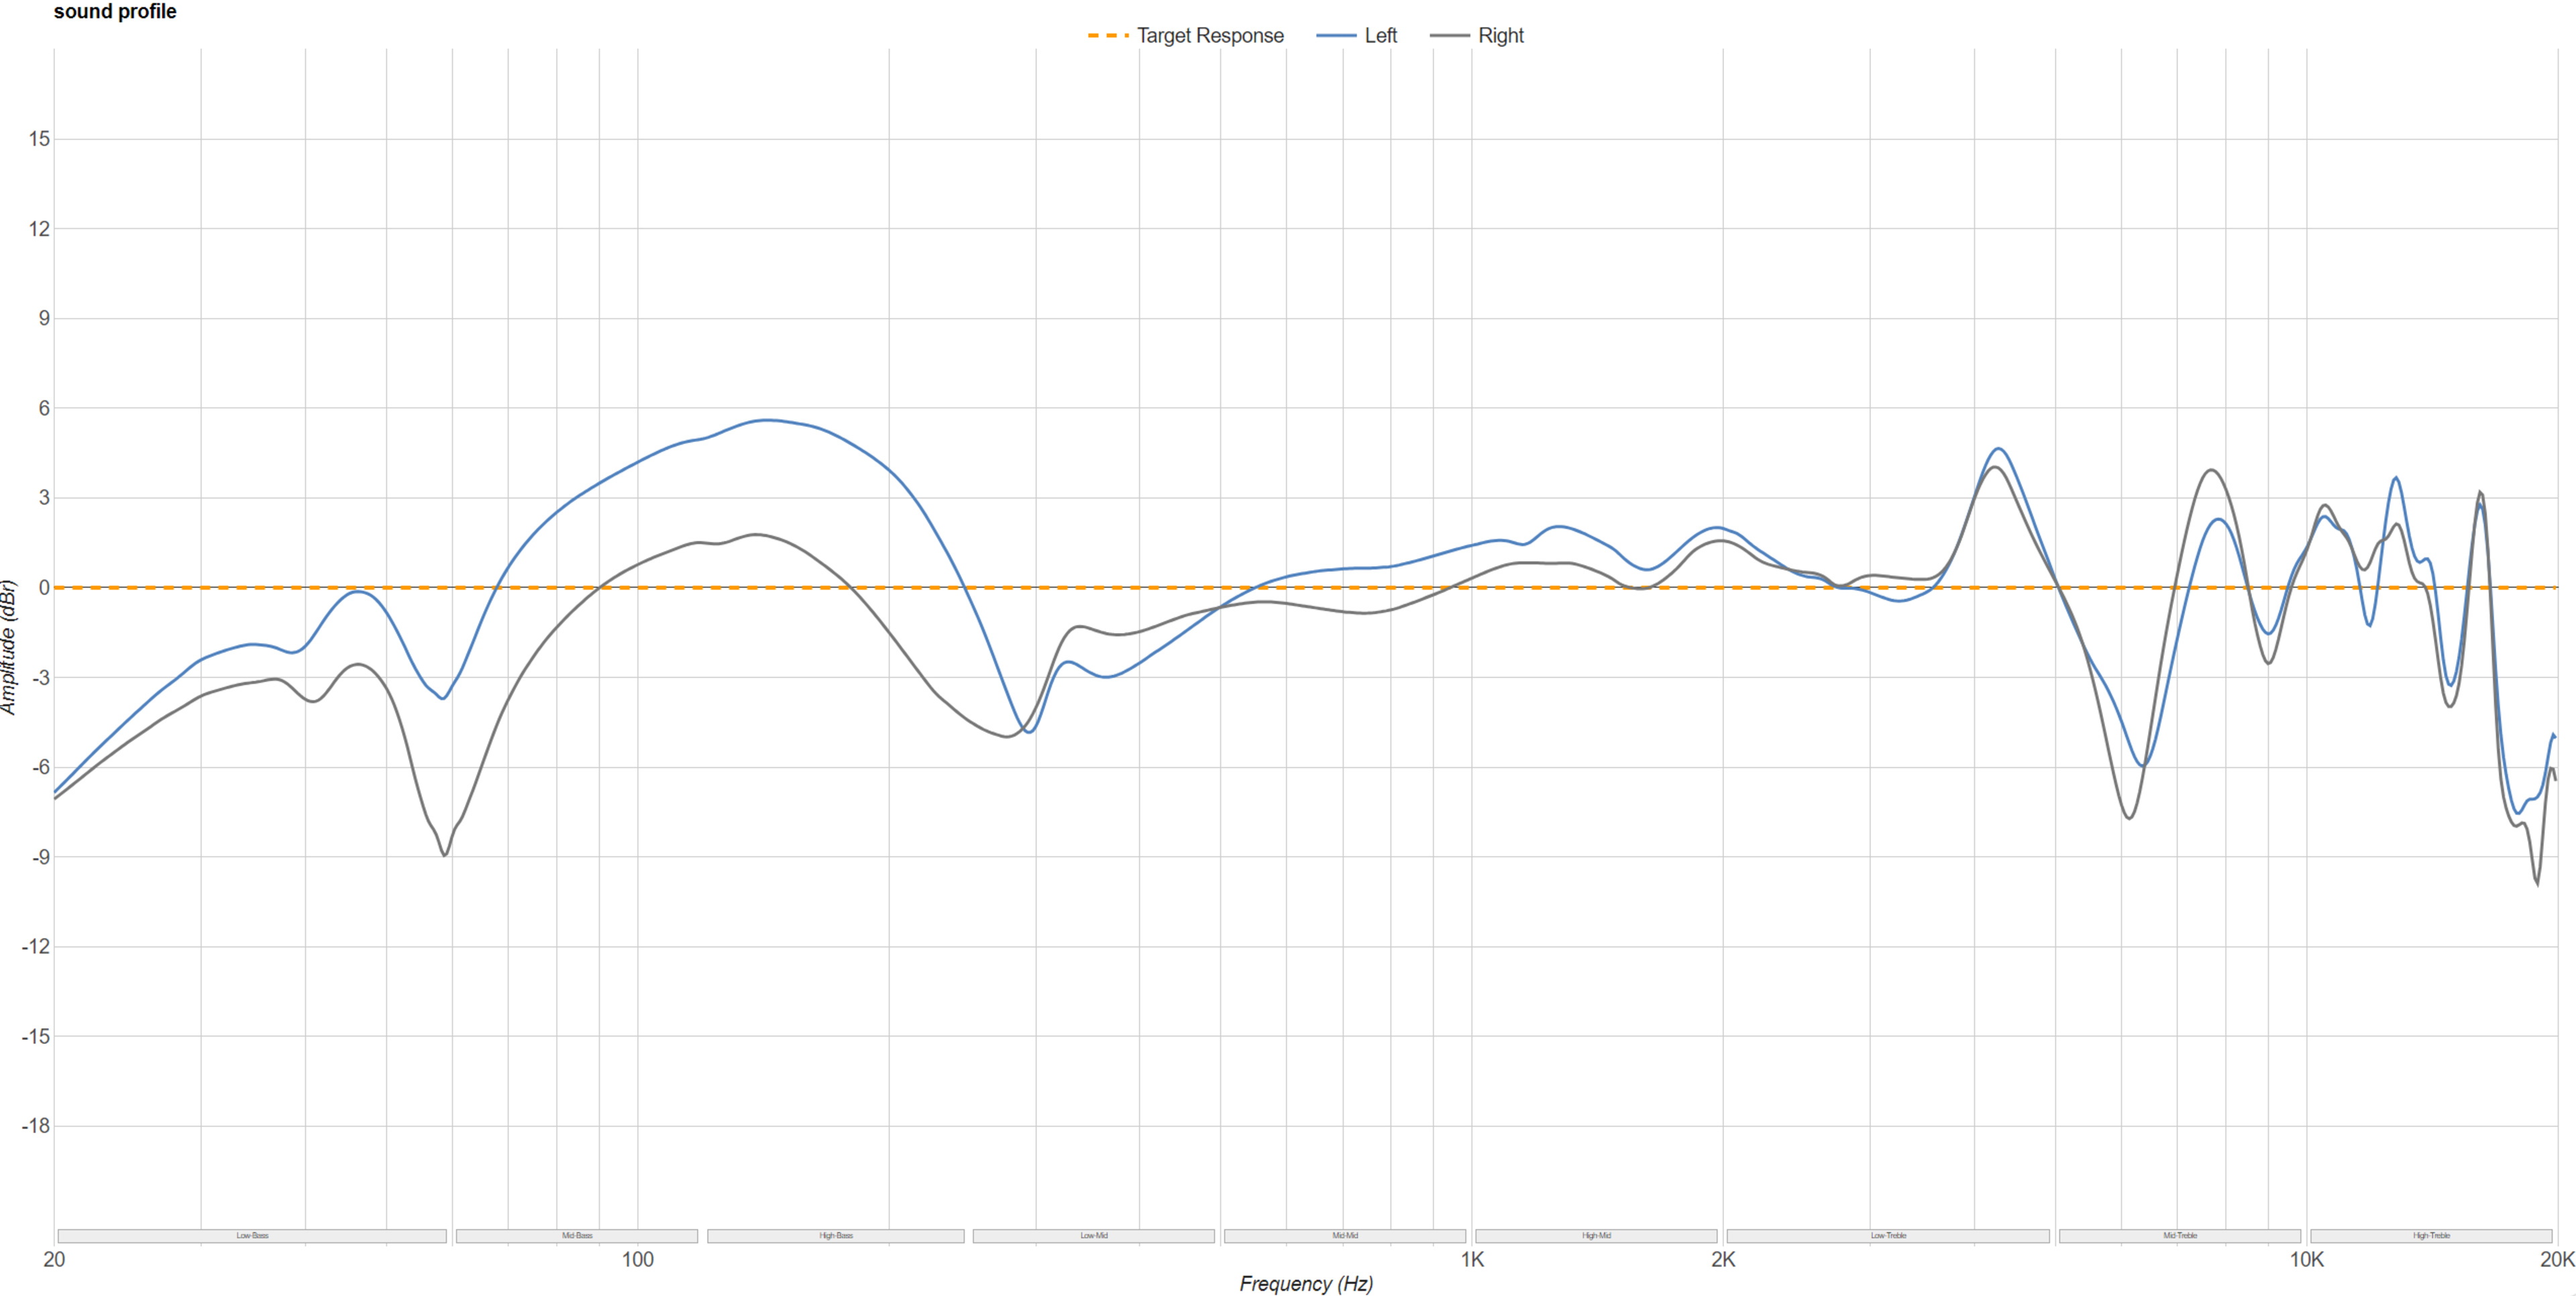 |  |
| Treble Amount: -5.0 dB dB | Treble Amount: -0.2dB | Treble Amount: 0.7dB |
Like Bass Amount, this test isn't scored either and isn't an indicator of 'good' or 'bad' treble. Your own personal taste will play a role in determining whether this value is to your liking. You can also use Treble Amount to compare different products using our table and comparison tools.
Sound Signature
Sound Signature is an indicator of the general characteristics of headphones' sound profile, allowing users to quickly sort through and identify headphones that fit their preferences. It's calculated using an algorithm that takes into account the Bass and Treble Amount.
| Sound Signature | Characteristics |
| Boosted Bass | Bass-forward sound, with a de-emphasized treble range |
| V-shaped | Excited sound, with prominent bass and treble |
| Warm | Emphasized bass and low-mids, with rolled-off highs for a smoother sound |
| Flat | Follows a diffuse field sound target in the bass and treble |
| Balanced | Follows our target curve in the bass and treble |
| Bright | Emphasized and sharp treble, with a more recessed bass response |
| Elevated Mid-range | Under-emphasized treble and bass response, prominent mids |
Conclusion
Sound profile is a straightforward way of representing headphones' sound. The raw frequency response of a pair of headphones is compensated using our target curve or any of the other targets available in our graphing tool, so you can easily see which frequencies are under and/or overemphasized compared to your target of choice. The bass and treble amounts also indicate how much deviation away from our target is present in each range, which can be useful if you want to sort headphones by these factors.