- Table of Contents
- Intro
- Our Tests
- Conclusion
- Recent Updates
- Comments
This article briefly introduces each Sound Quality Test in Test Bench 2.0 (check out the changelog). While we're working on updating each individual article to reflect our new methodology, some pages haven't been updated yet.
While you might consider headphones for their styling and build (Apple AirPods Max) or for deep integration with your ecosystem (Sonos Ace), fundamentally, headphones are audio products, so sound is a key component of their performance. You'll want good-sounding headphones, whether you're listening to podcasts, presentations, or pop. As you'd expect from the wide range of use cases and content, preferences play a big part in your selection. Some people may prefer low-end emphasis to feel the rumble of basslines, while others may gravitate towards balanced and flat signatures to focus on details like plucked guitar and violin pizzicato. It's not all about taste, though; some elements of sound are objective—everyone can agree on what constitutes a good (or bad) result.
We evaluate sound using a mix of performance-based and preference-based tests. This article will give you an overview of how these tests will affect your listening experience, with links to in-depth test articles if you want to know more.
Our Tests
Before diving into the specifics, it's worth briefly discussing how we measure sound. We use a Brüel & Kjær Type 5128-B head and torso simulator (HATS) to capture audio in a way that closely mimics human hearing. Microphones placed deep in the simulated ear canals record what a listener would perceive in real-world conditions. The physical characteristics of the HATS are based on extensive studies of ear geometry, designed to approximate an average human response. If you'd like to find out why we decided on this HATS, you can learn more about why it matters and how it's helped us shape our methodology.
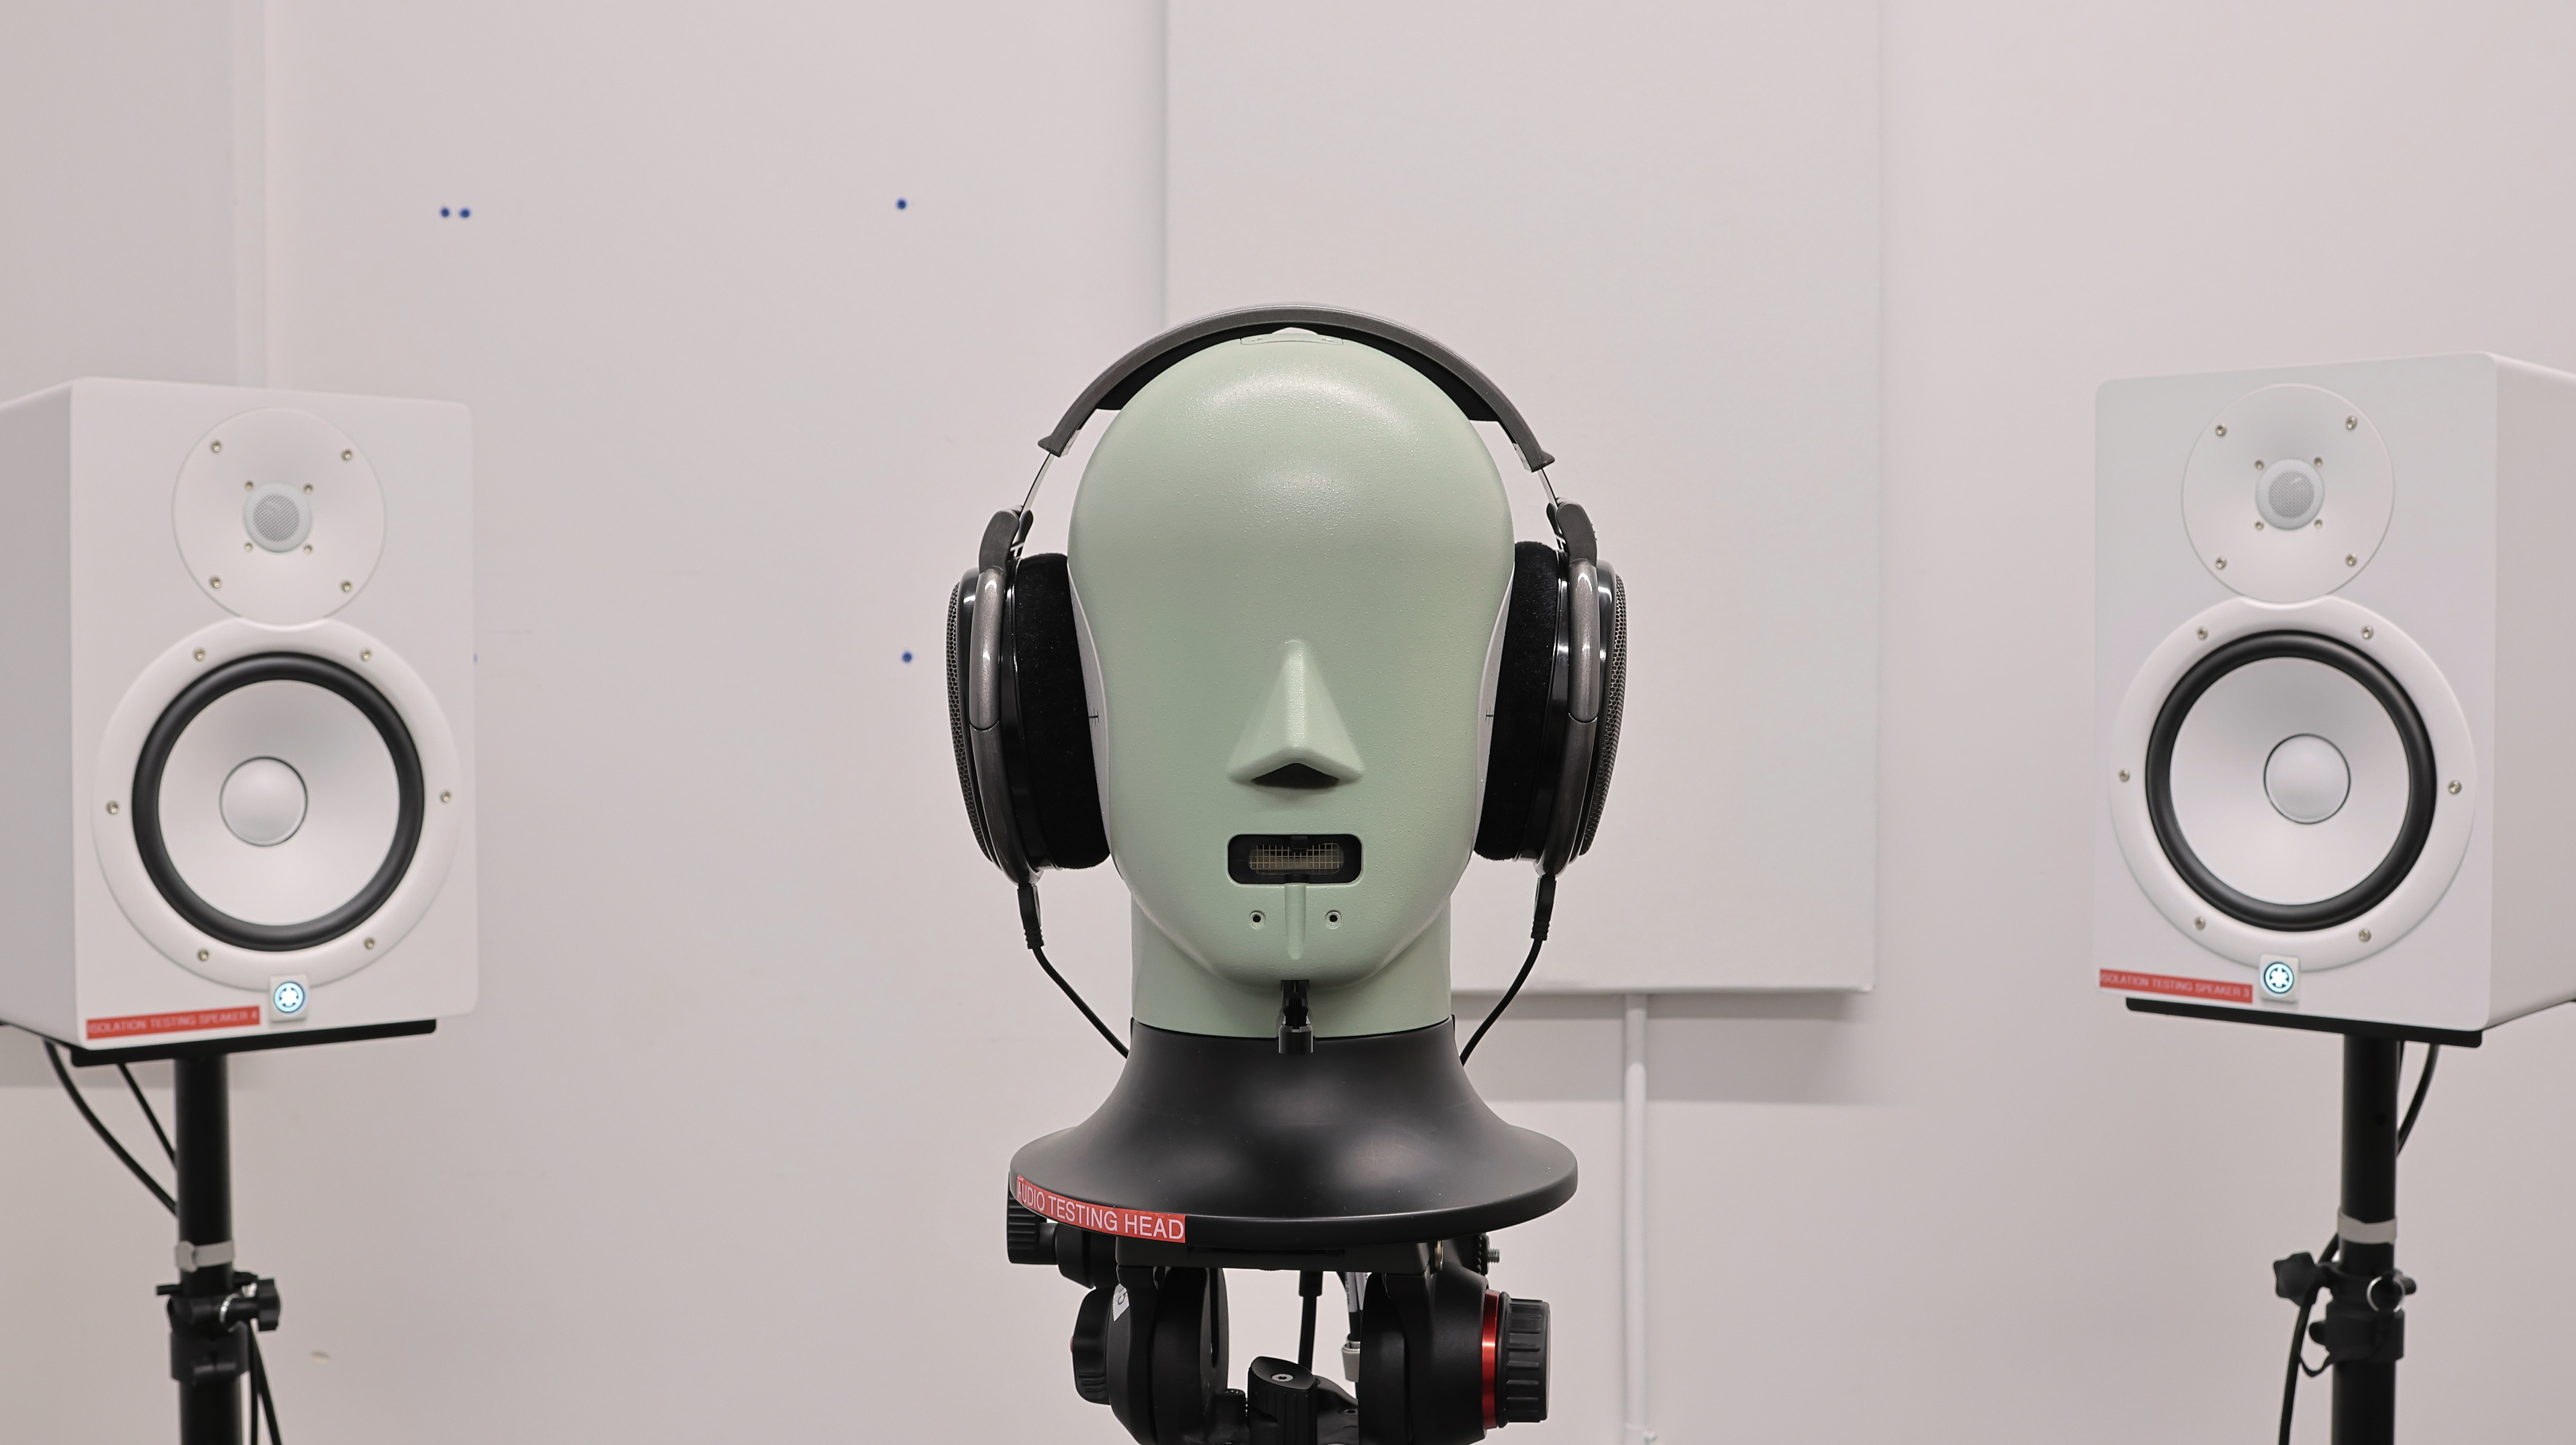
There are many valid ways to approach headphone measurements, each grounded in distinct assumptions about how we hear. Some labs and publications use alternative methods to visualize results or account for listener preference, while others rely on their own target curves or normalization strategies. What matters most for us is consistency. By using the same equipment, procedures, and analysis across all reviews, we ensure our results are directly comparable.
Raw Frequency Response
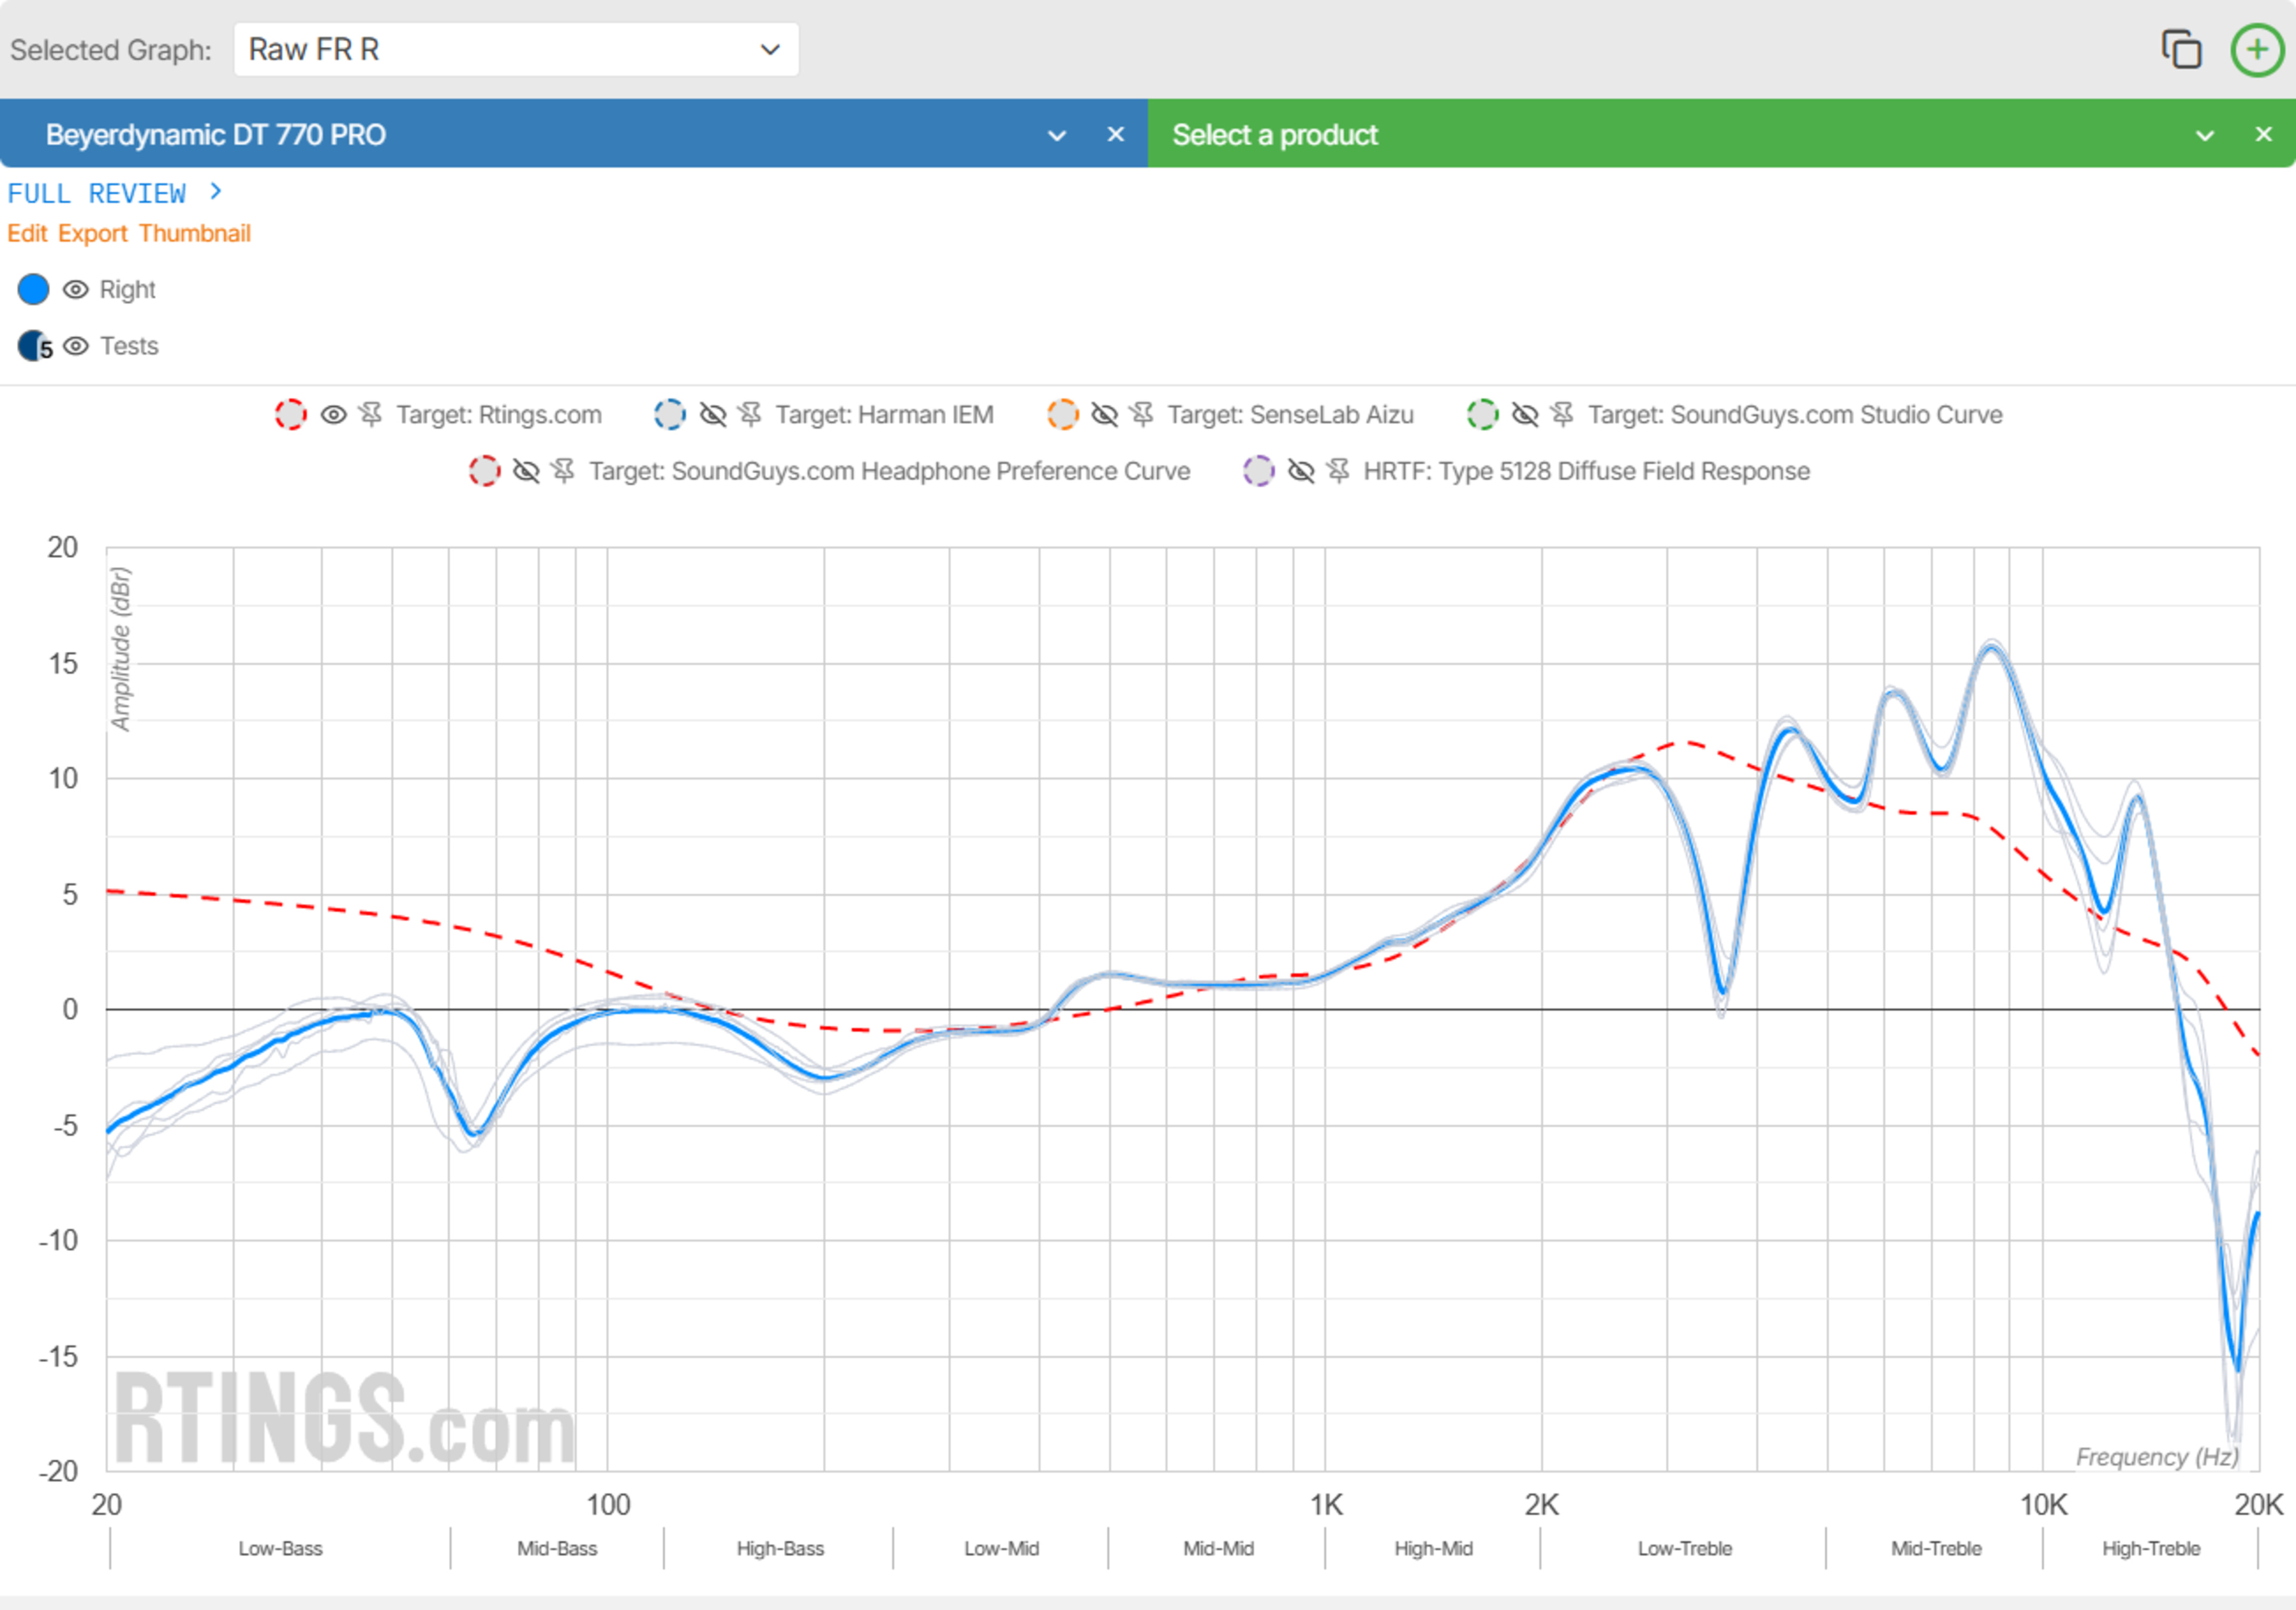
Raw Frequency Response is a measure of the magnitude of the output of a system compared to its input, as a function of frequency. In simpler terms, it describes how accurately a system reproduces audio across a measured range of frequencies. For example, for an input signal that has three frequencies of equal amplitude (say, 100Hz, 1kHz, and 10kHz, all at -6 dB FS), a system with a flat frequency response would output a signal that, just like the input, has equal amplitudes at 100Hz, 1kHz, and 10kHz. This explanation works for measurements taken from a microphone in the open, but things get a bit more complicated when measurements are taken with a HATS to simulate how we experience audio.
Simply put, our bodies modify and filter frequencies in a specific way characterized by a model called a Head-Related Transfer Function (HRTF). In practice, what we perceive as a flat headphone frequency response using the earlier example would not have an equal amplitude output at 100Hz, 1kHz, and 10kHz when measured at our eardrums (or simulated with a HATS). By taking measurements using a HATS, the HRTF (of the specific head) is inherently included in the raw frequency response, which can be unintuitive to read as a flat sound signature will not appear as a flat line on an uncompensated graph.
If you're an experienced user, you may prefer this representation of headphones' sound since you can easily compare it to our in-house curve, or one of several validated curves provided by Harman, SenseLab and Aizu University, and SoundGuys.com. That said, some may prefer to visualize headphones' sound after the frequency response has been normalized in our sound profile test.
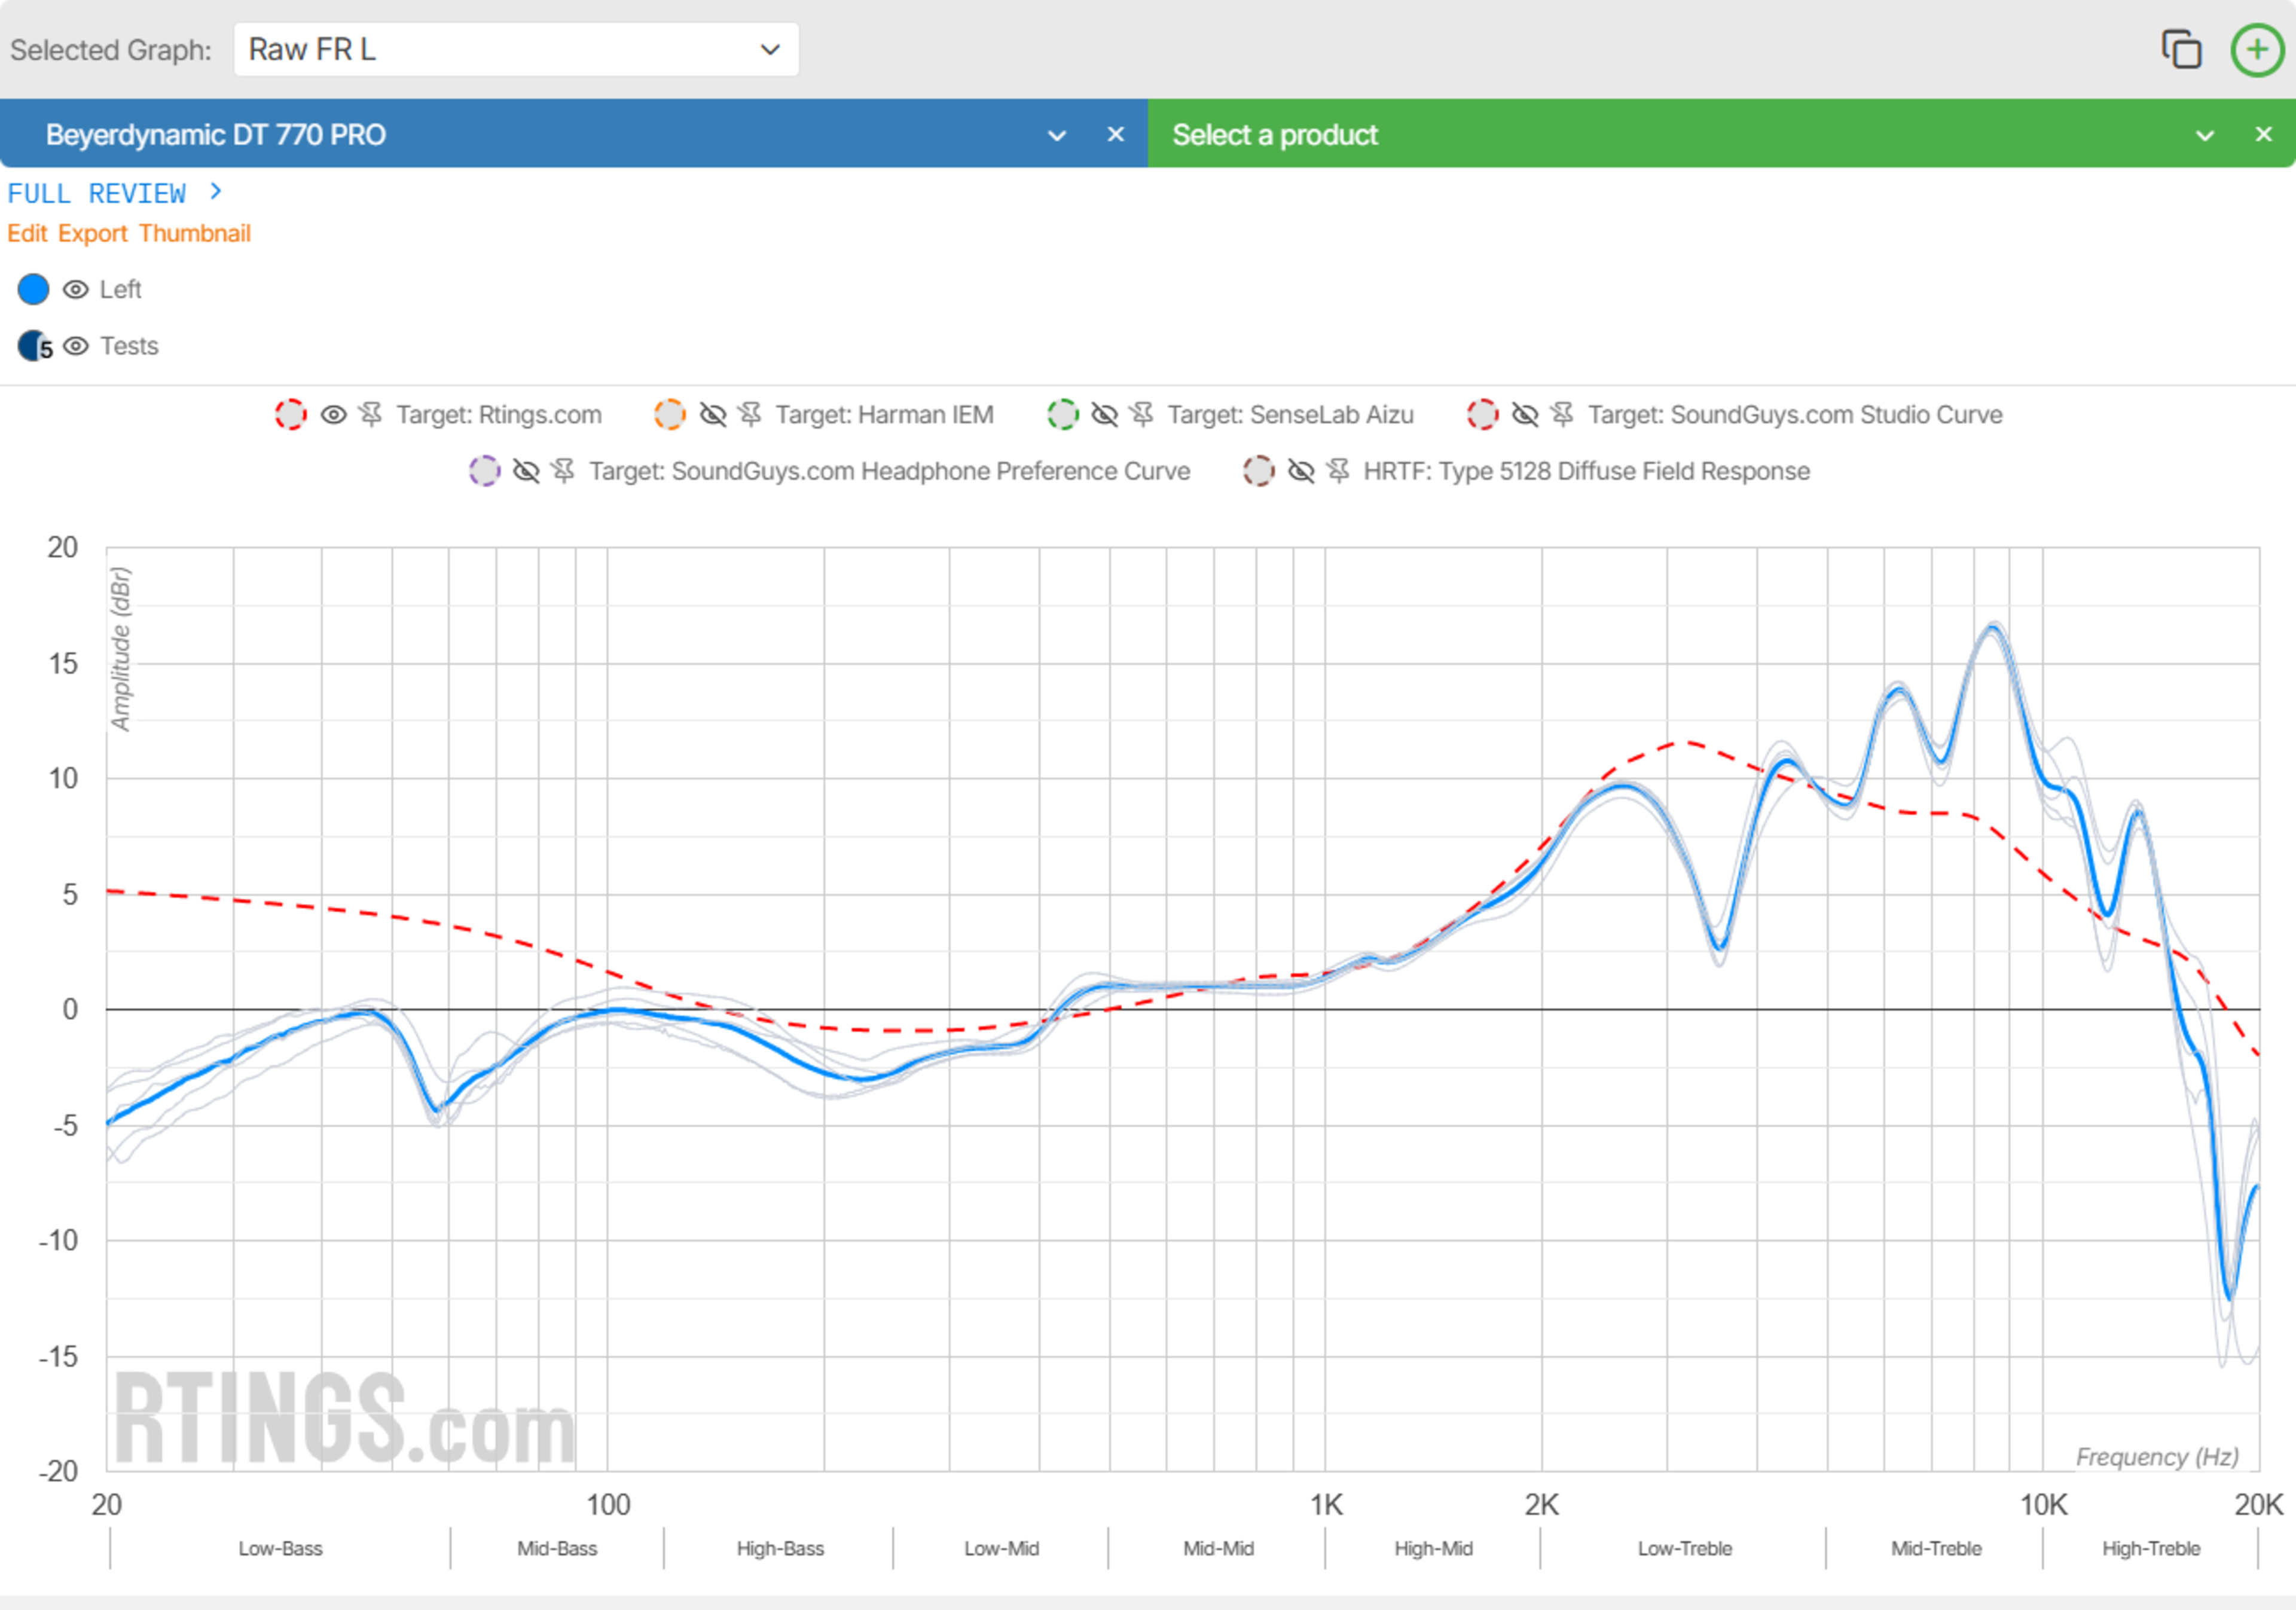 |  |
Sound Profile
Sound Profile is an alternative visualization of the headphones' frequency response. By default, this test normalizes the frequency response to our in-house target curve, which sets the target as the frame of reference and represents a pair of headphones' output amplitude relative to the reference as a function of frequency. Although you can only normalize to one curve at a time, you can freely switch your frame of reference by selecting from the same set of curves supported by our raw frequency response test. Visualizing the headphones' sound this way can be a better way to understand how you'll perceive their sound for some. You can also normalize the Bass, Mid-Range, and Treble Profile: Target Compliance to these different targets for a closer zoom, though the compliance won't be scored in the graph tool.
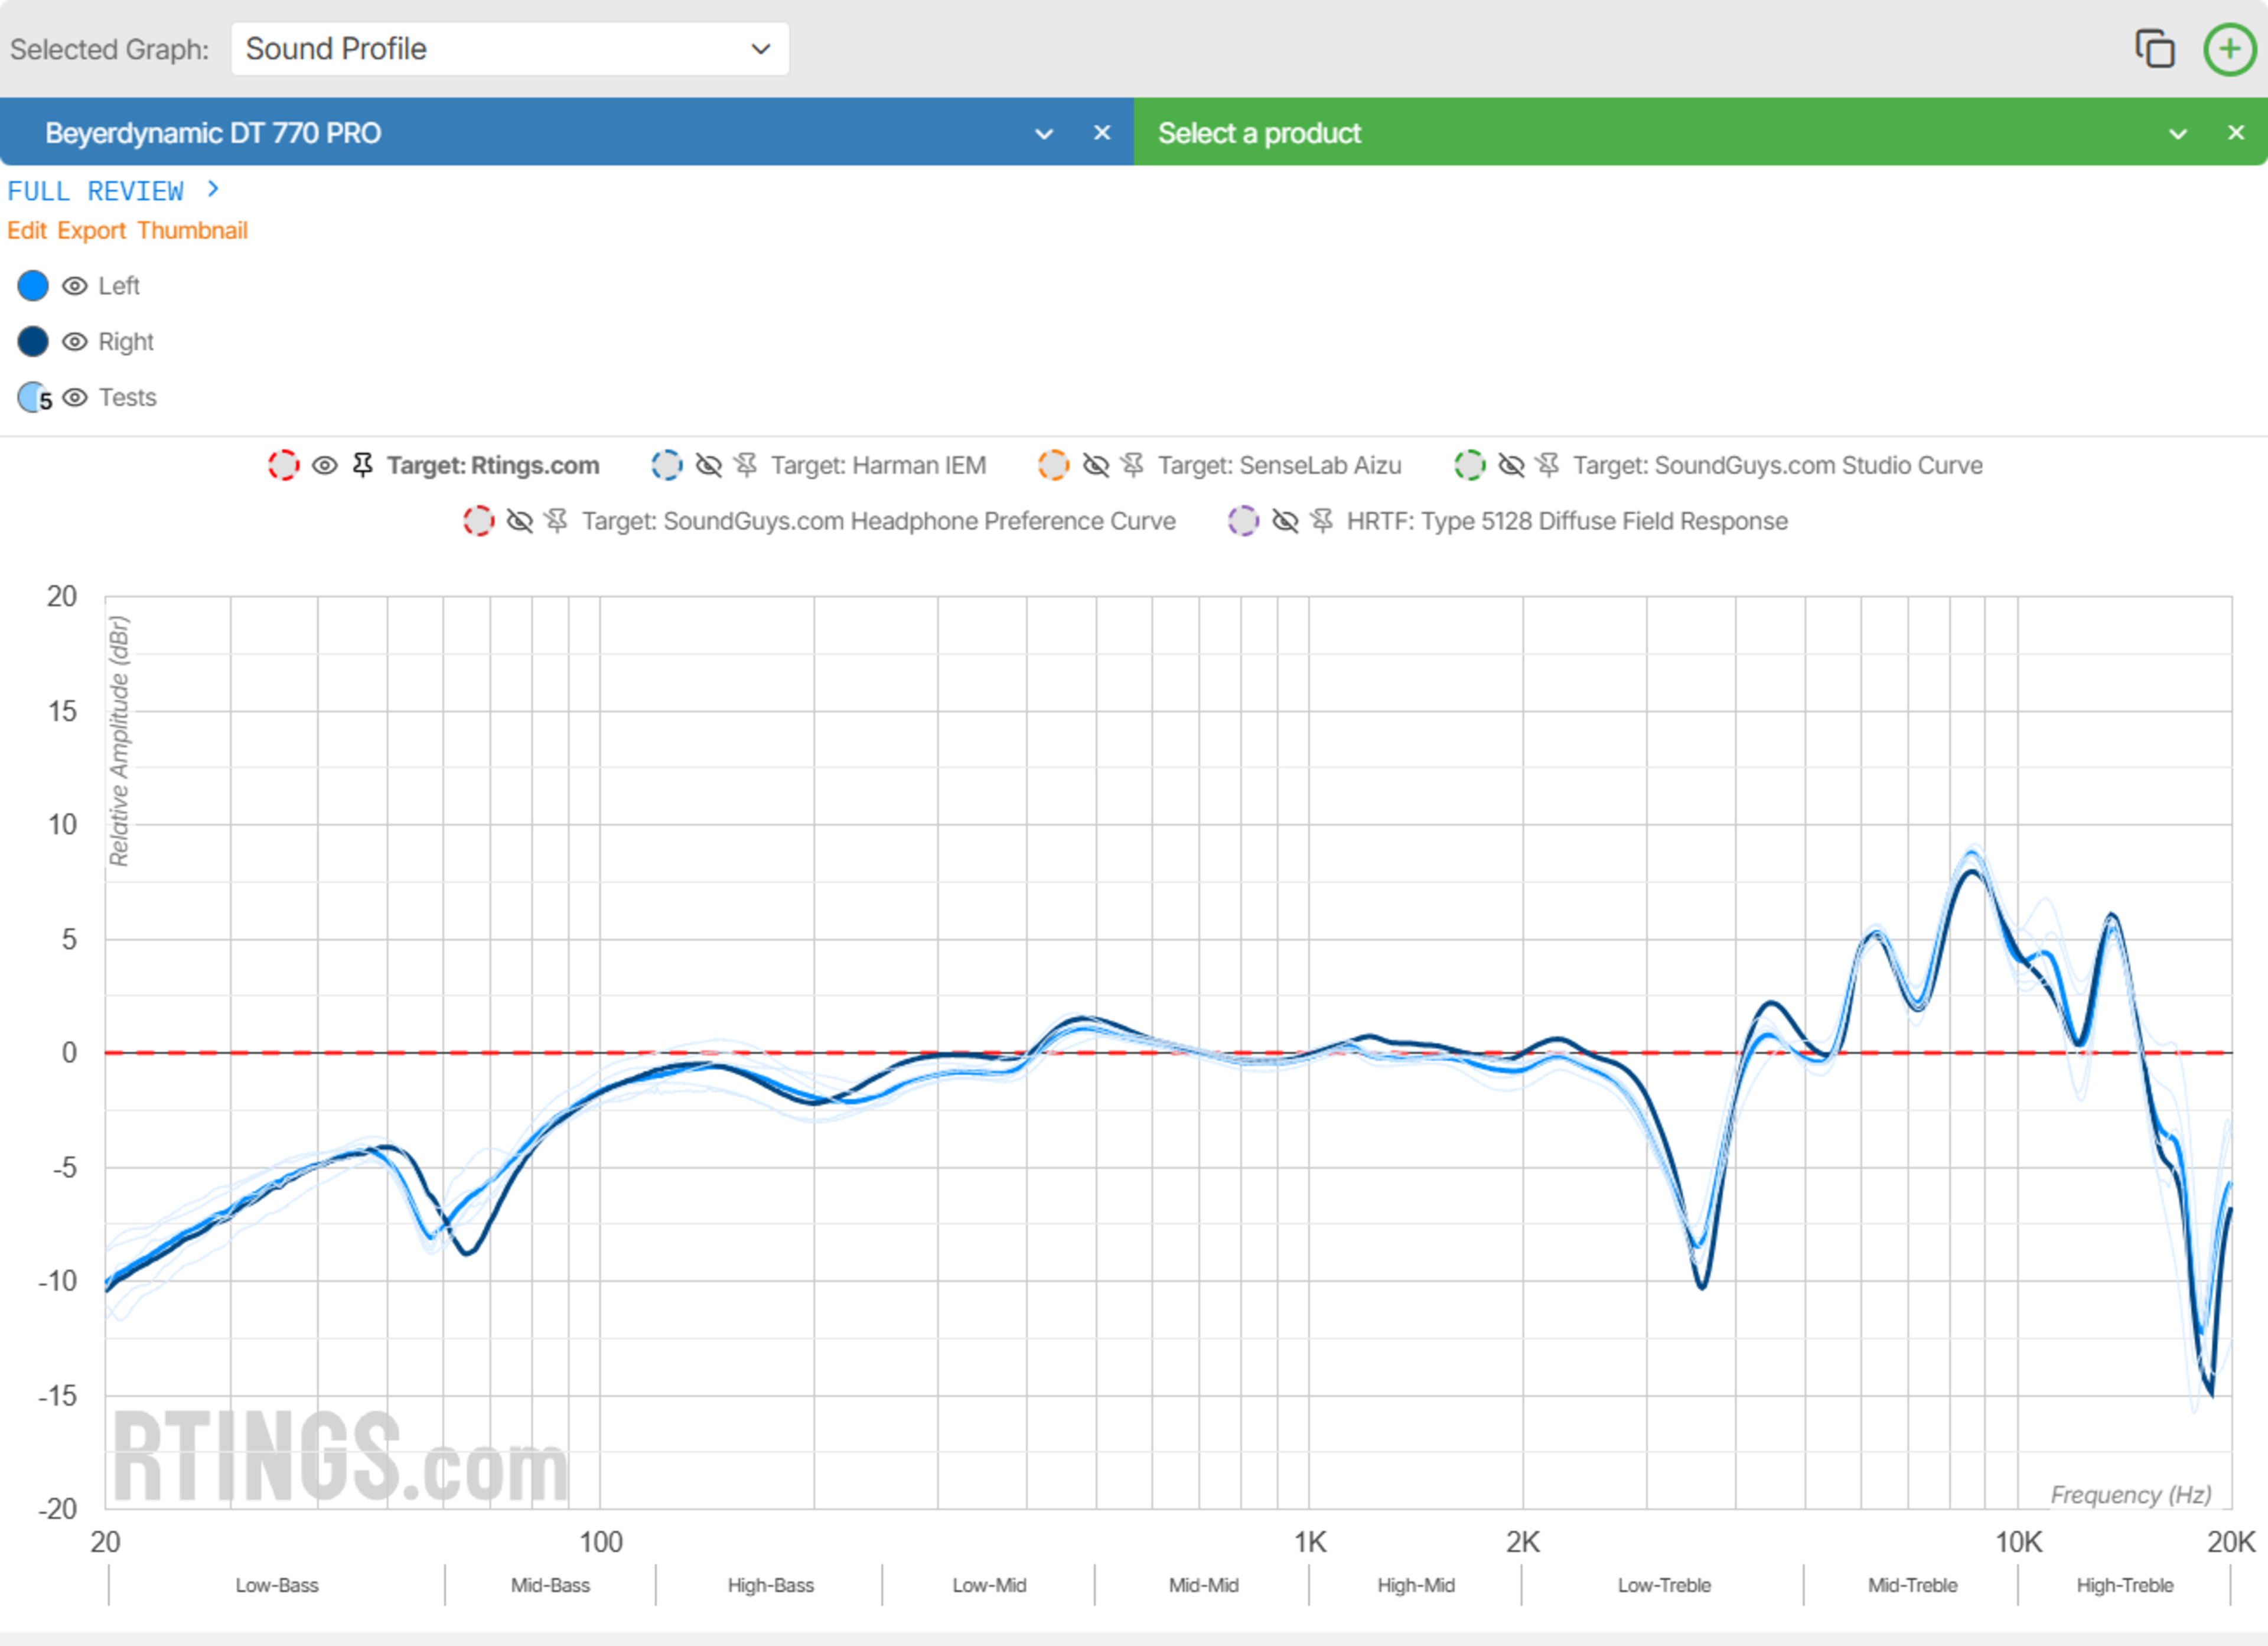
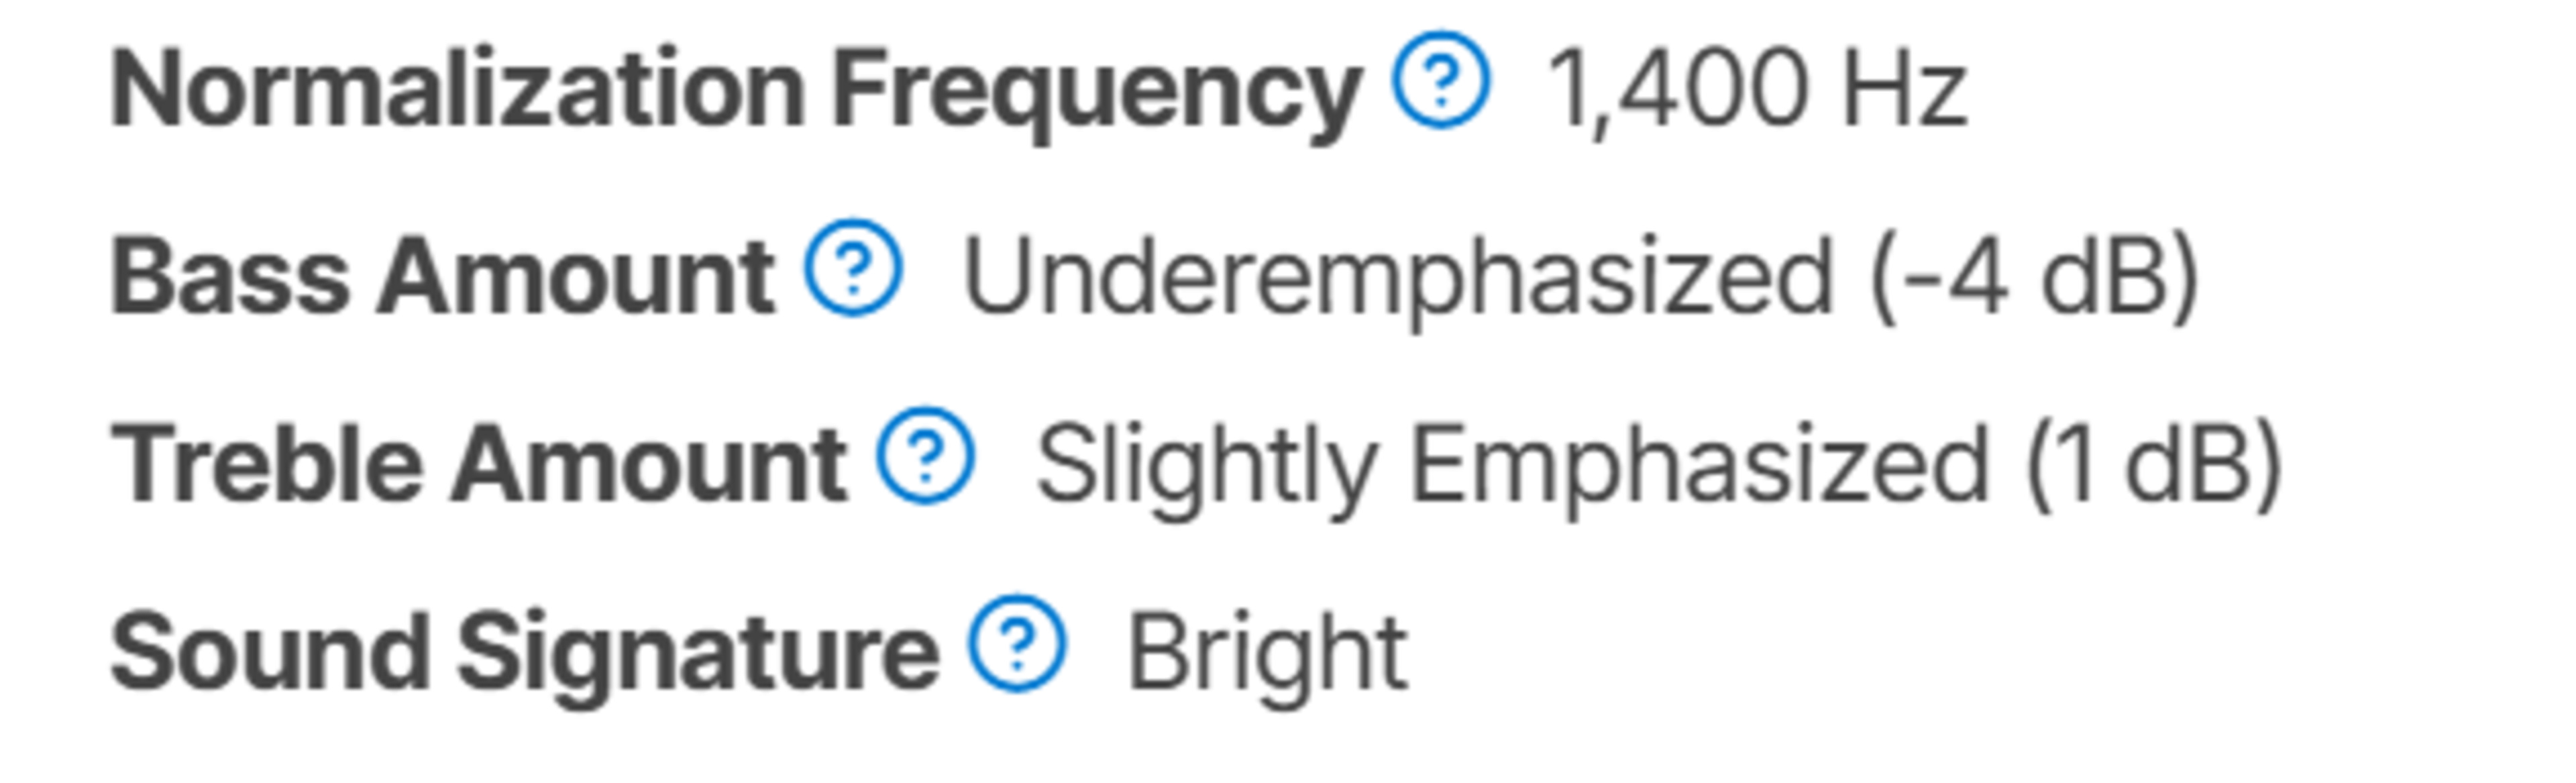
In addition to the graph tool, the sound profile test algorithmically categorizes the headphones' Sound Signature using averaged Bass and Treble Amounts. This test is especially useful if you're just starting your audiophile journey, as it provides easy-to-understand measurements and general categorization.
Frequency Response Consistency
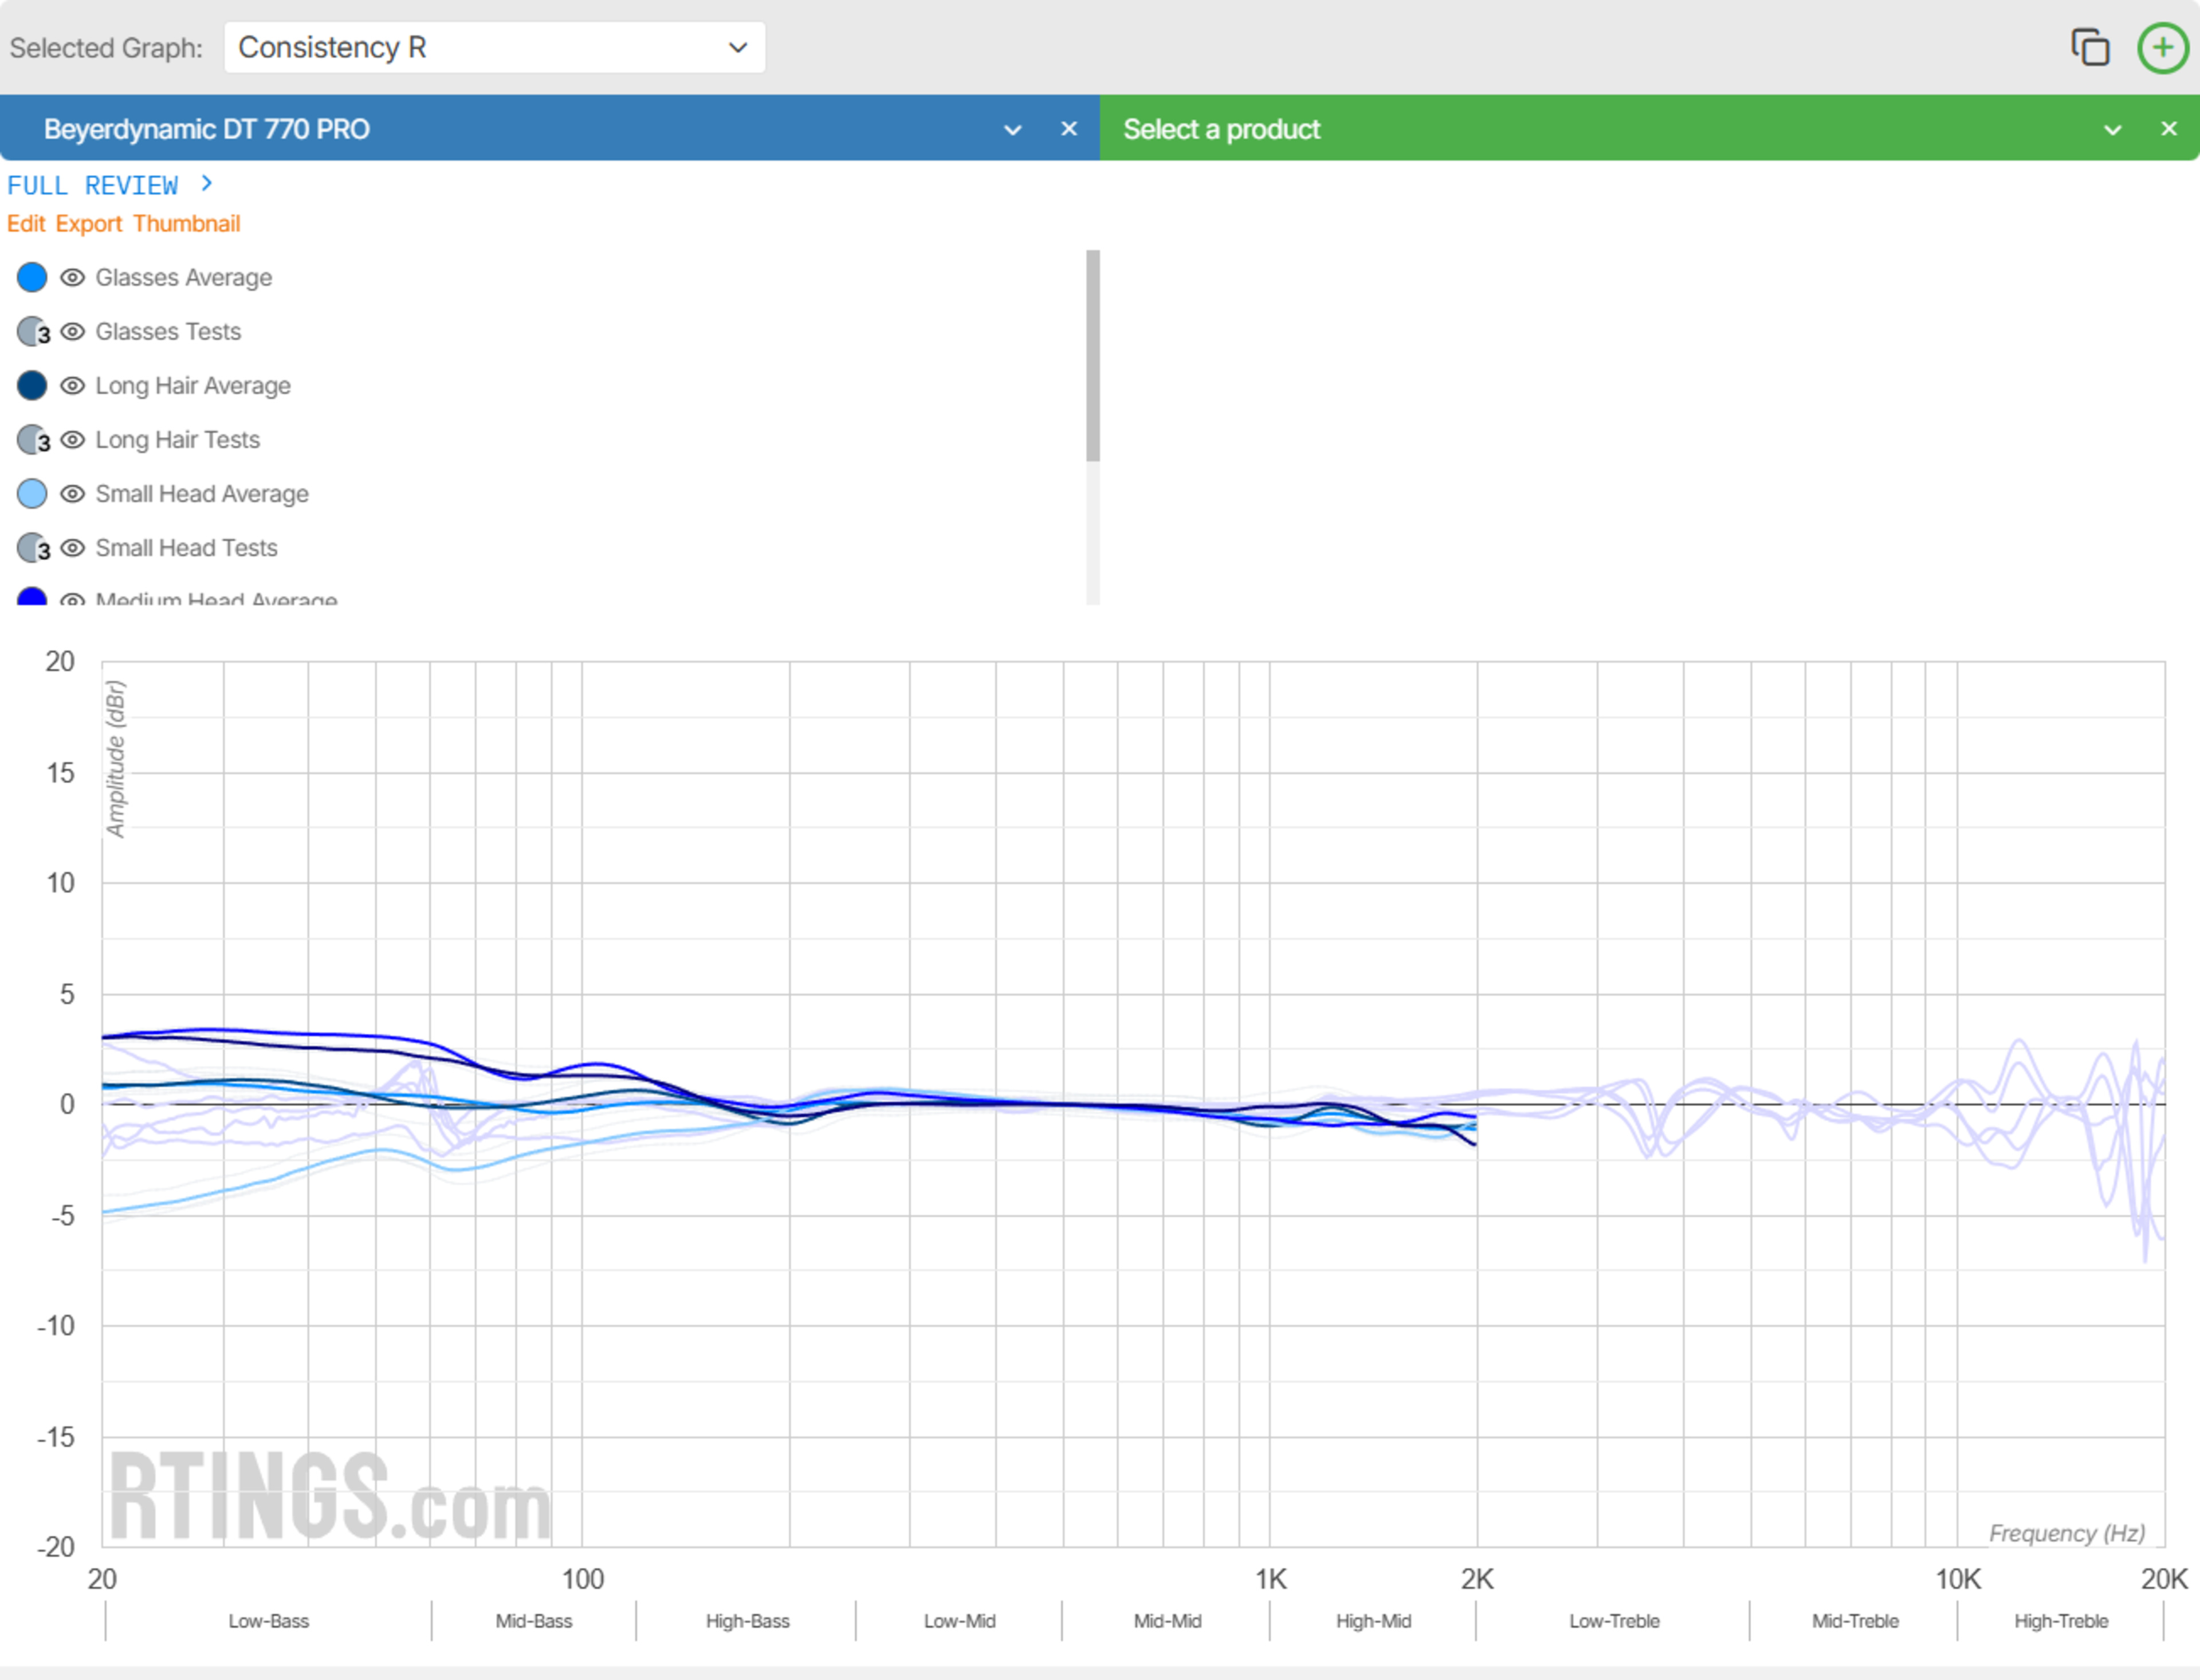
- 1.0% Avg. Std. Deviation
Frequency Response Consistency is one of the most important tests for headphones. It aims to characterize deviations in audio delivery caused by physical differences between wearers and variations in headphone placement. In simpler terms, depending on the seal and positioning of ear cups or ear tips, headphones can sound different from person to person. These variations are often influenced by factors like the size and shape of your head, ears, ear canals, and whether you have longer hair or wear glasses. The most common deviations occur when the ear cups or tips fail to form a good seal, resulting in reduced bass compared to our raw frequency response measurements. That said, we include both individual passes and averages for our listed physical characteristics; it's worth keeping in mind that there can also be variability between passes even on the same person. If you wear glasses, you may not always experience a drop in bass, especially if your headphones have higher-quality earpads and you take the time to adjust their fit. In essence, this test indicates how closely your personal listening experience will align with the rest of our measurements for the headphones' sound.
 |  |
Bass Profile: Target Compliance
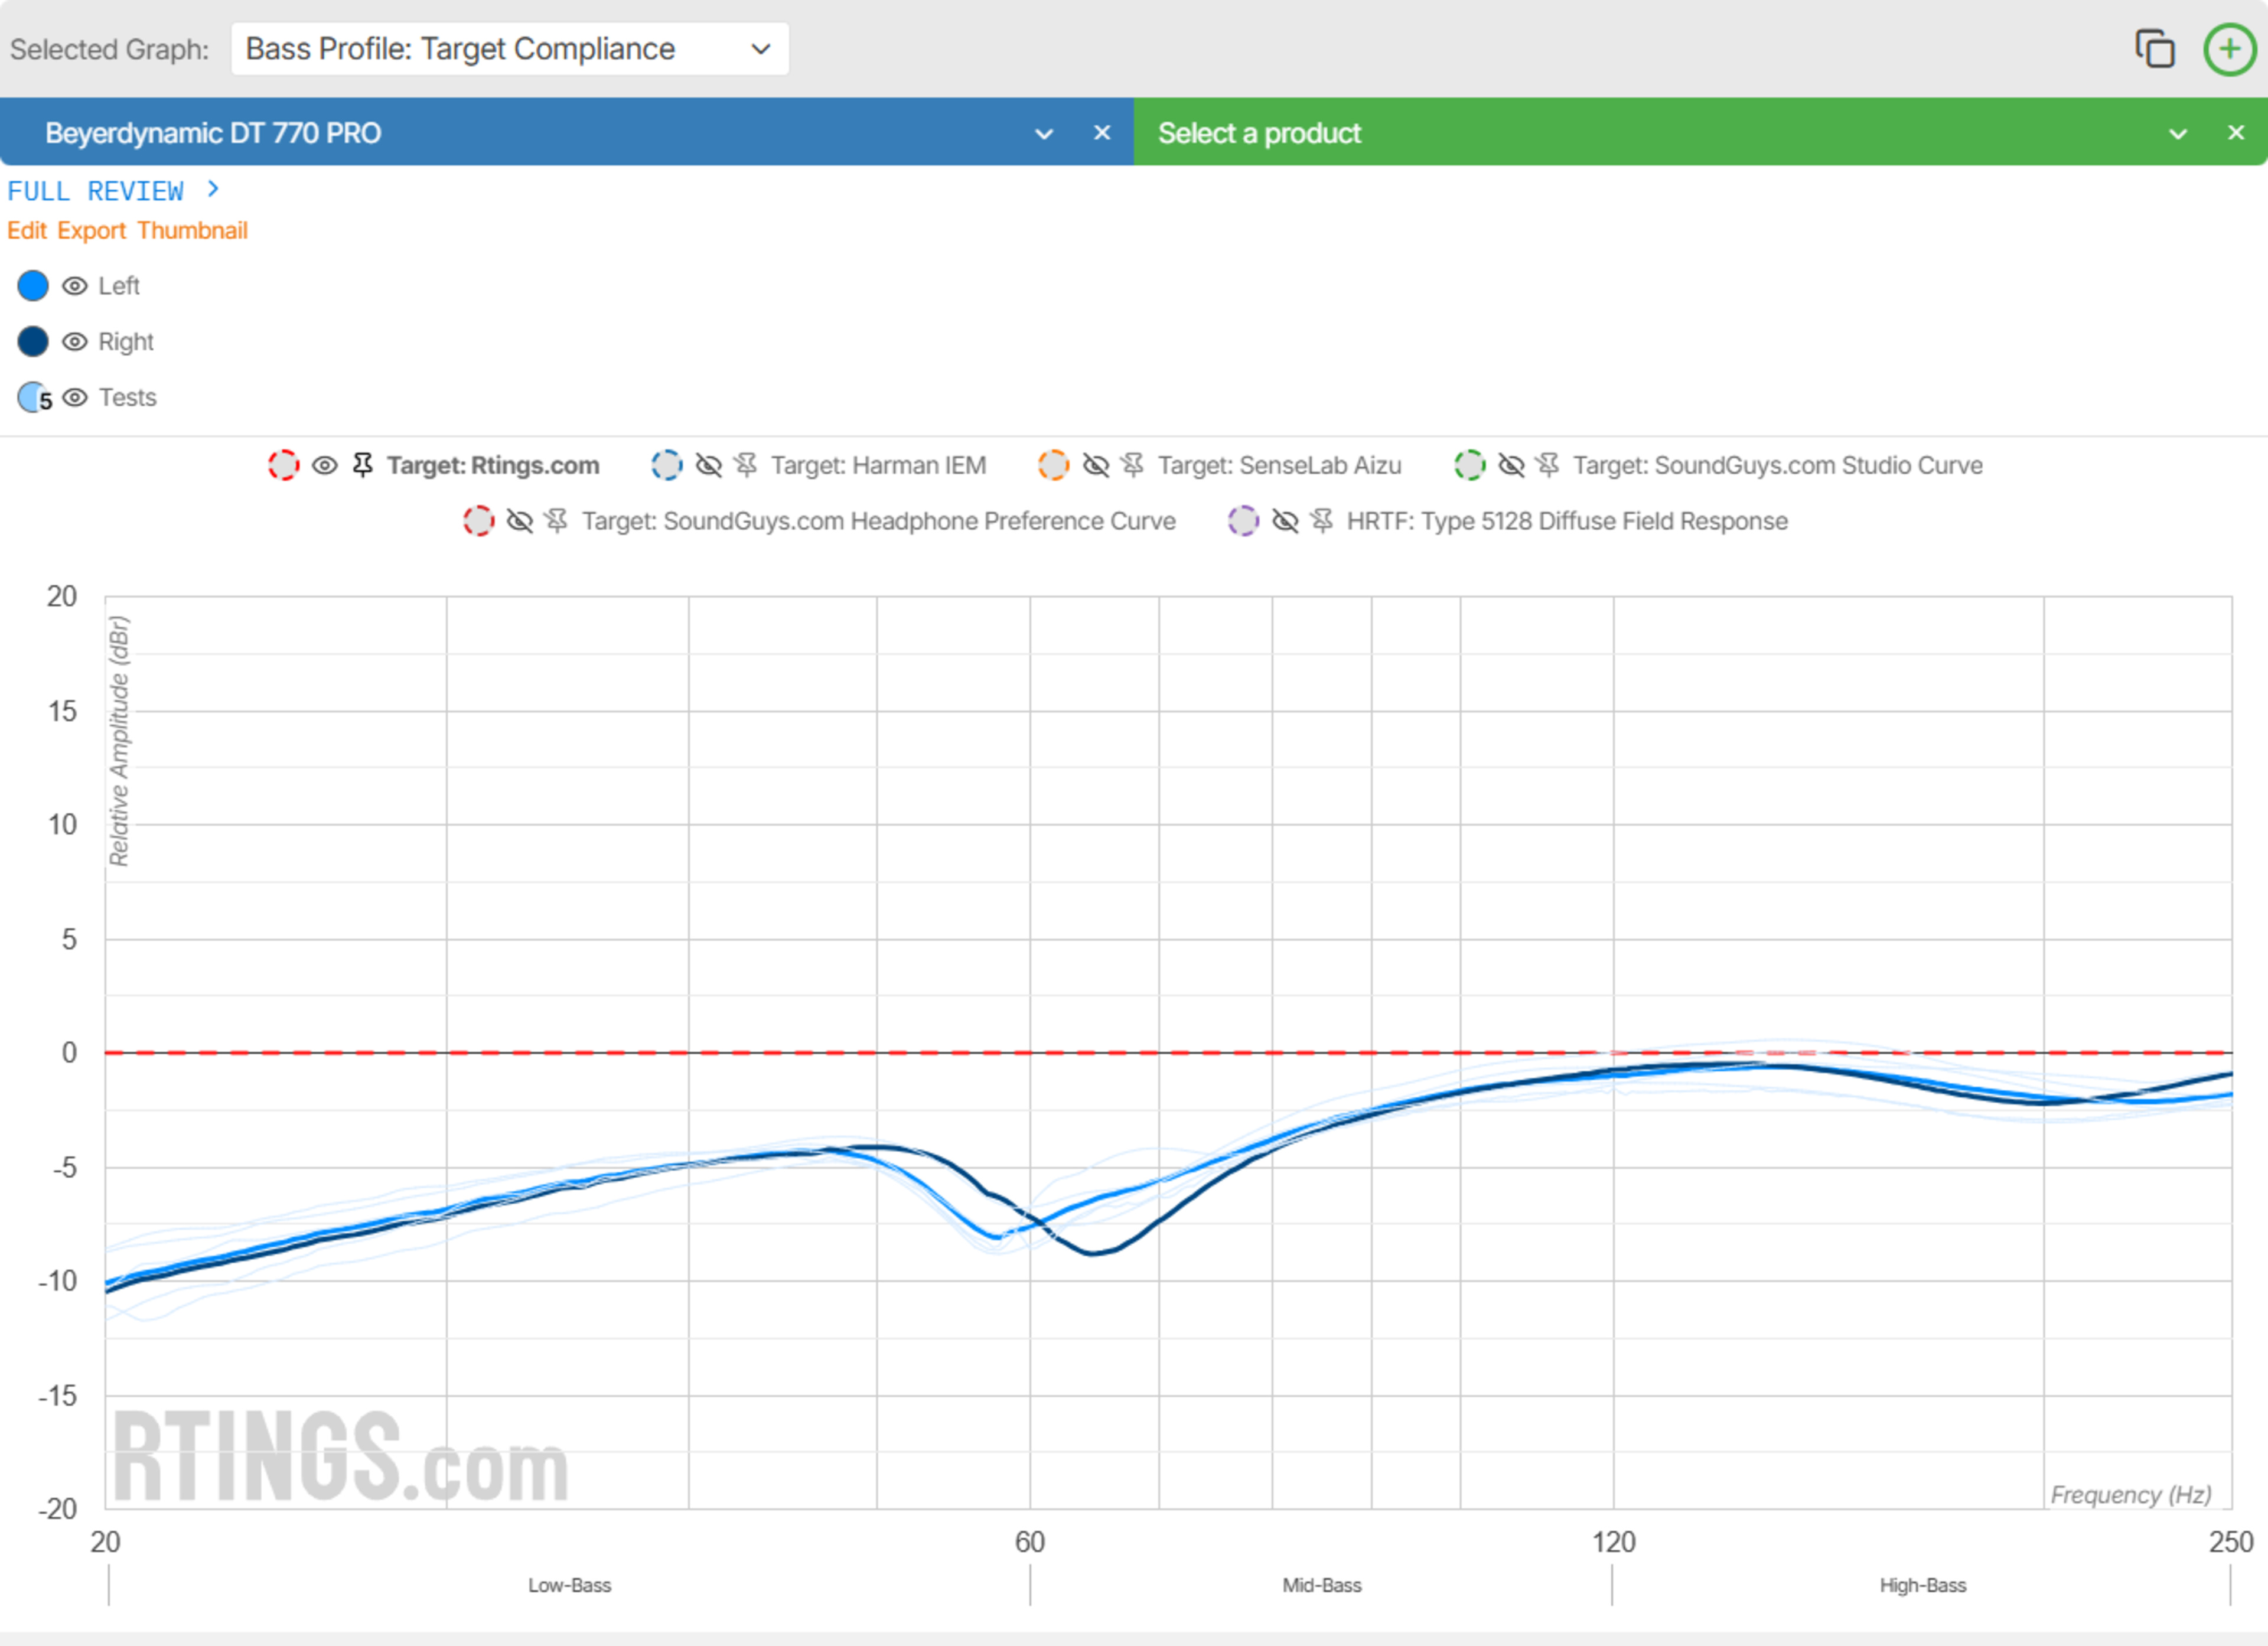
- 90.0% RMS Deviation From Target
- 10.0% Low-Frequency Extension
Bass Profile: Target Compliance describes how closely the headphones reproduce the low-frequency region of the audible frequency spectrum in relation to our target curve. This range starts from 20Hz and goes up to 250Hz. It represents the low thump/rumble, punch/kick, and melodious basslines you can hear in tracks.
This test is scored using two factors: low-frequency extension, which tells you the lowest frequency response a pair of headphones can produce before significant roll-off, and the degree to which the response deviates from our target curve.
Mid-Range Profile: Target Compliance
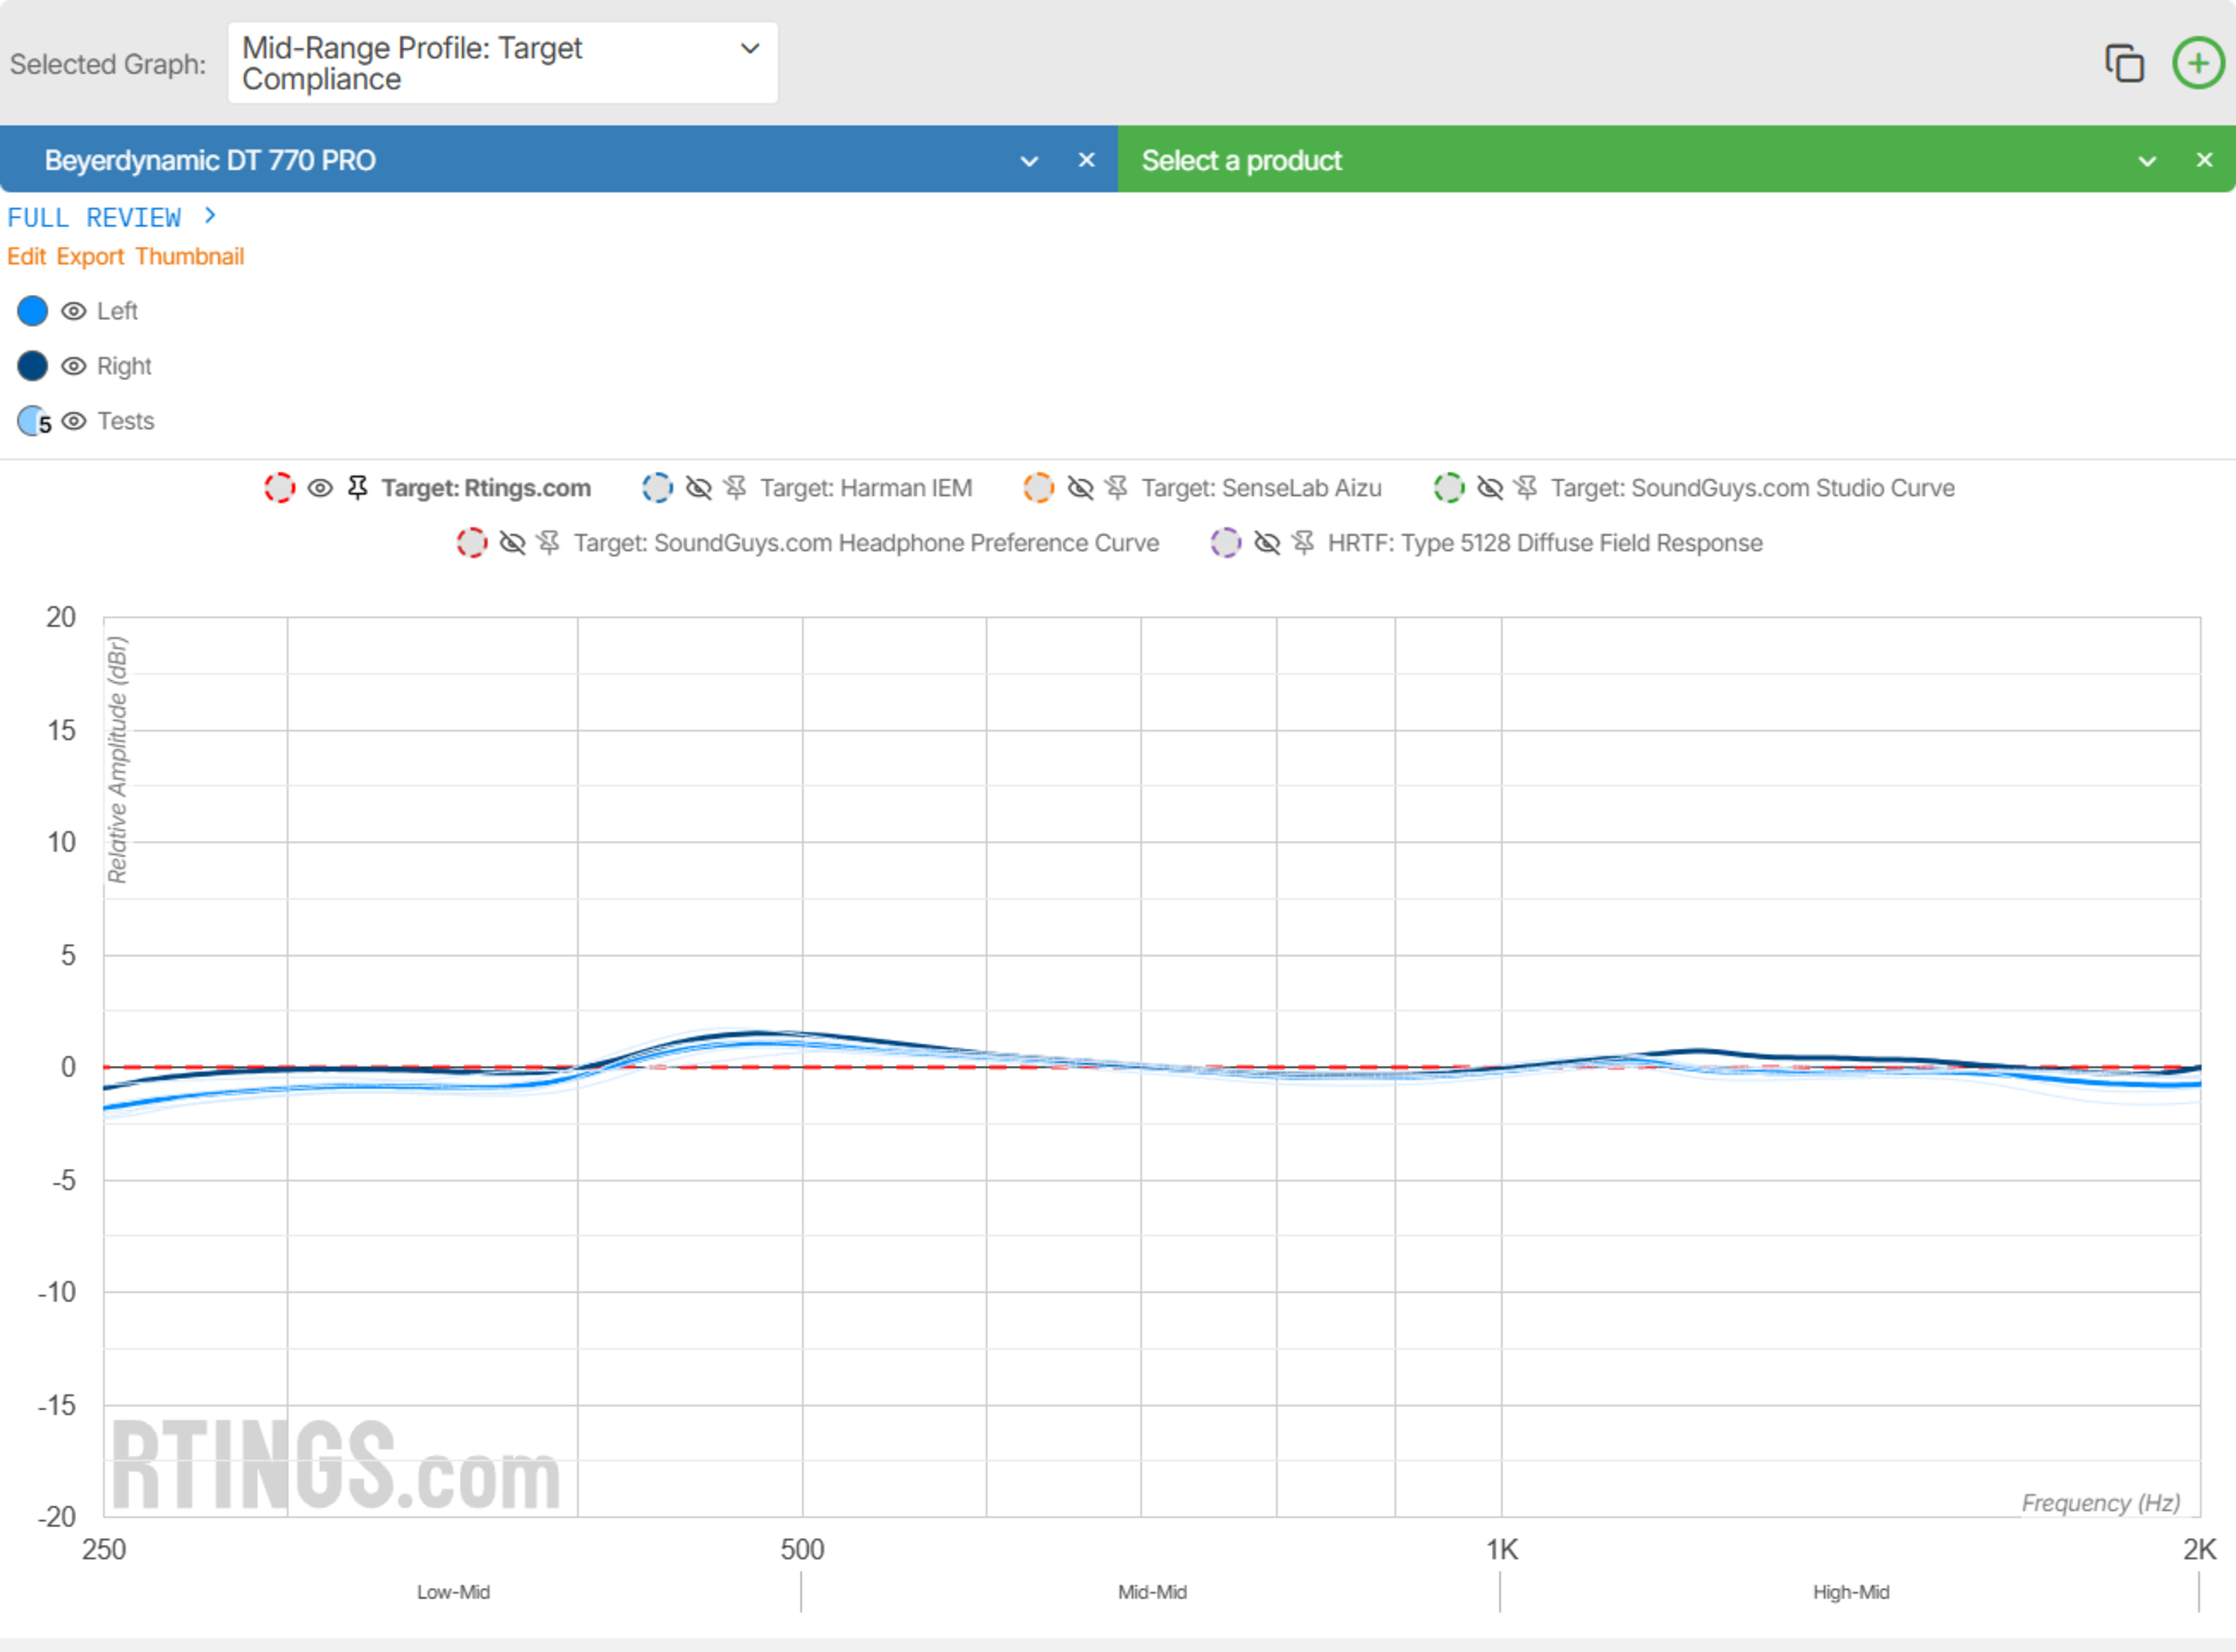
Mid-Range Profile: Target Compliance describes how a pair of headphones' mid-range frequency response deviates in relation to our target curve. The mid-range spans 250Hz to 2kHz. It represents the lower and higher harmonics of instruments and vocals and their comprehensibility and clarity; this is where most audible audio frequencies reside.
This test is only scored by how much deviation exists in this range relative to our target curve.
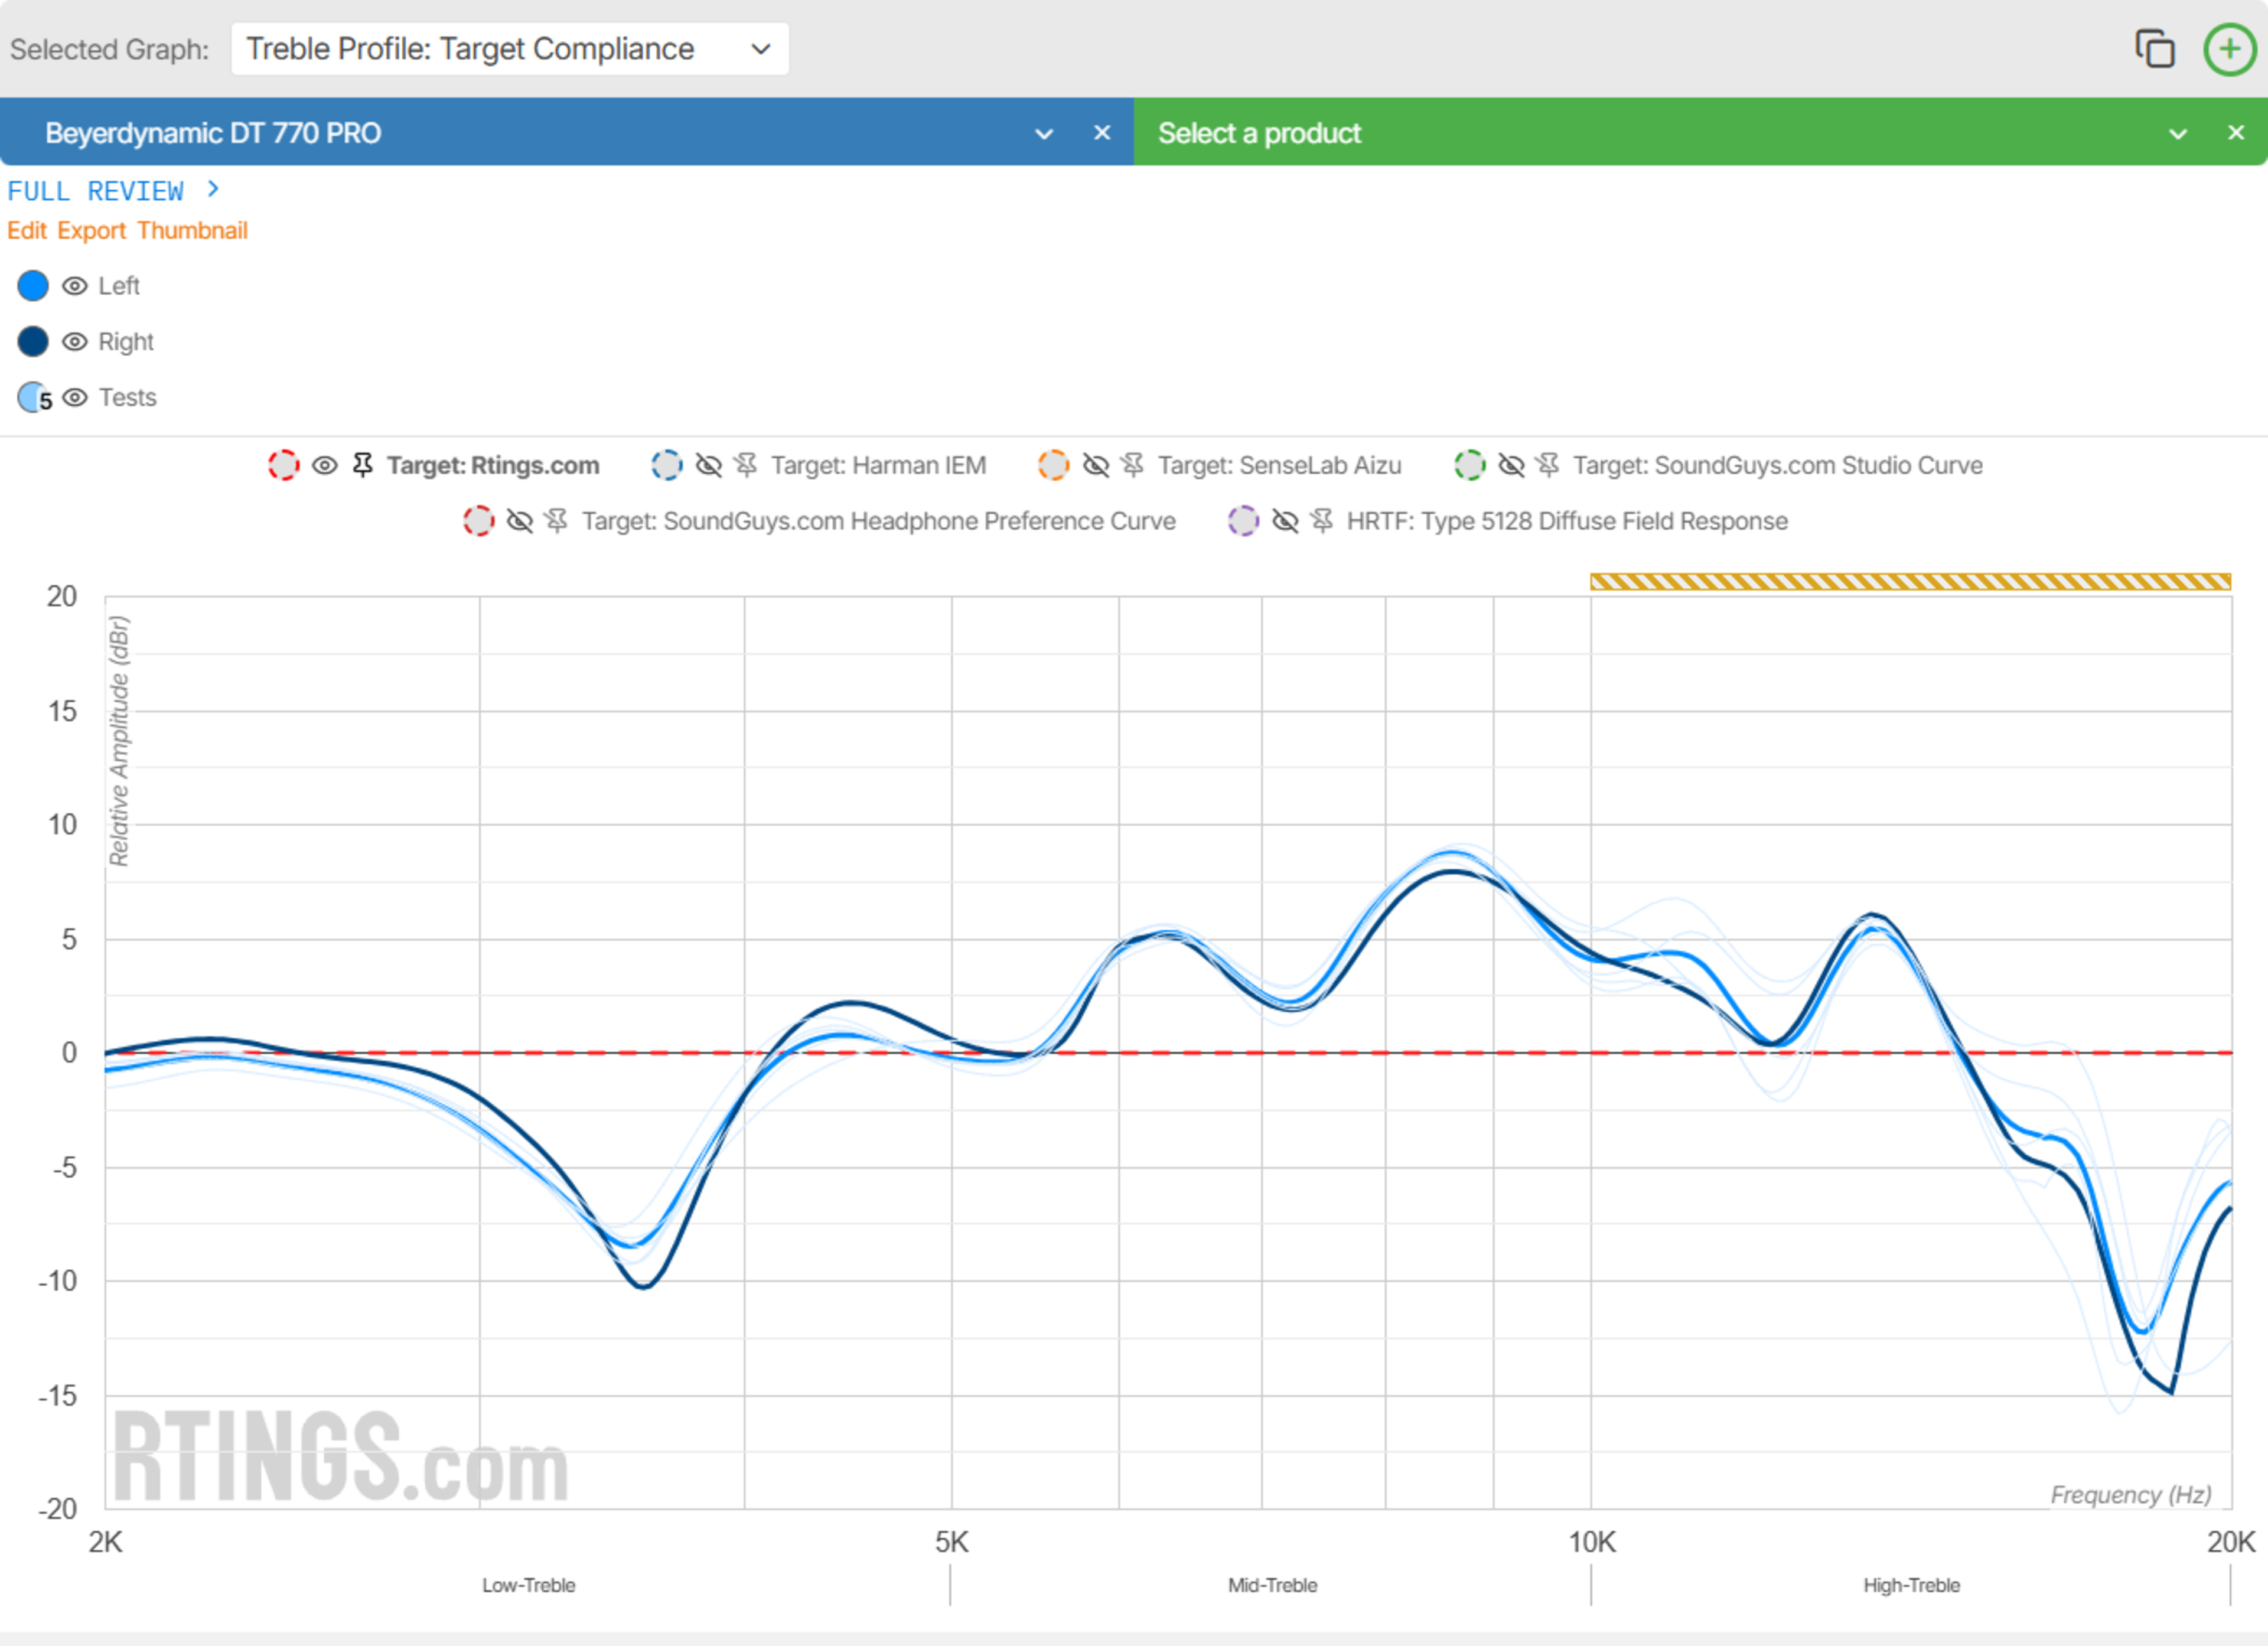
Treble Profile: Target Compliance
Treble Profile: Target Compliance describes how a pair of headphones reproduce the high frequencies of the audible frequency spectrum. The treble ranges from 2kHz to 20kHz and represents the higher harmonics of lead instruments and vocals, cymbals, the sibilant tones (S and T sounds), and the airiness you can hear in tracks.
This test is only scored using how much deviation exists in this range relative to our target curve. It's worth pointing out that treble measurements past 10kHz should be considered uncertain; variability in ear canal shape and age can affect both the objective and perceived amounts of high treble.
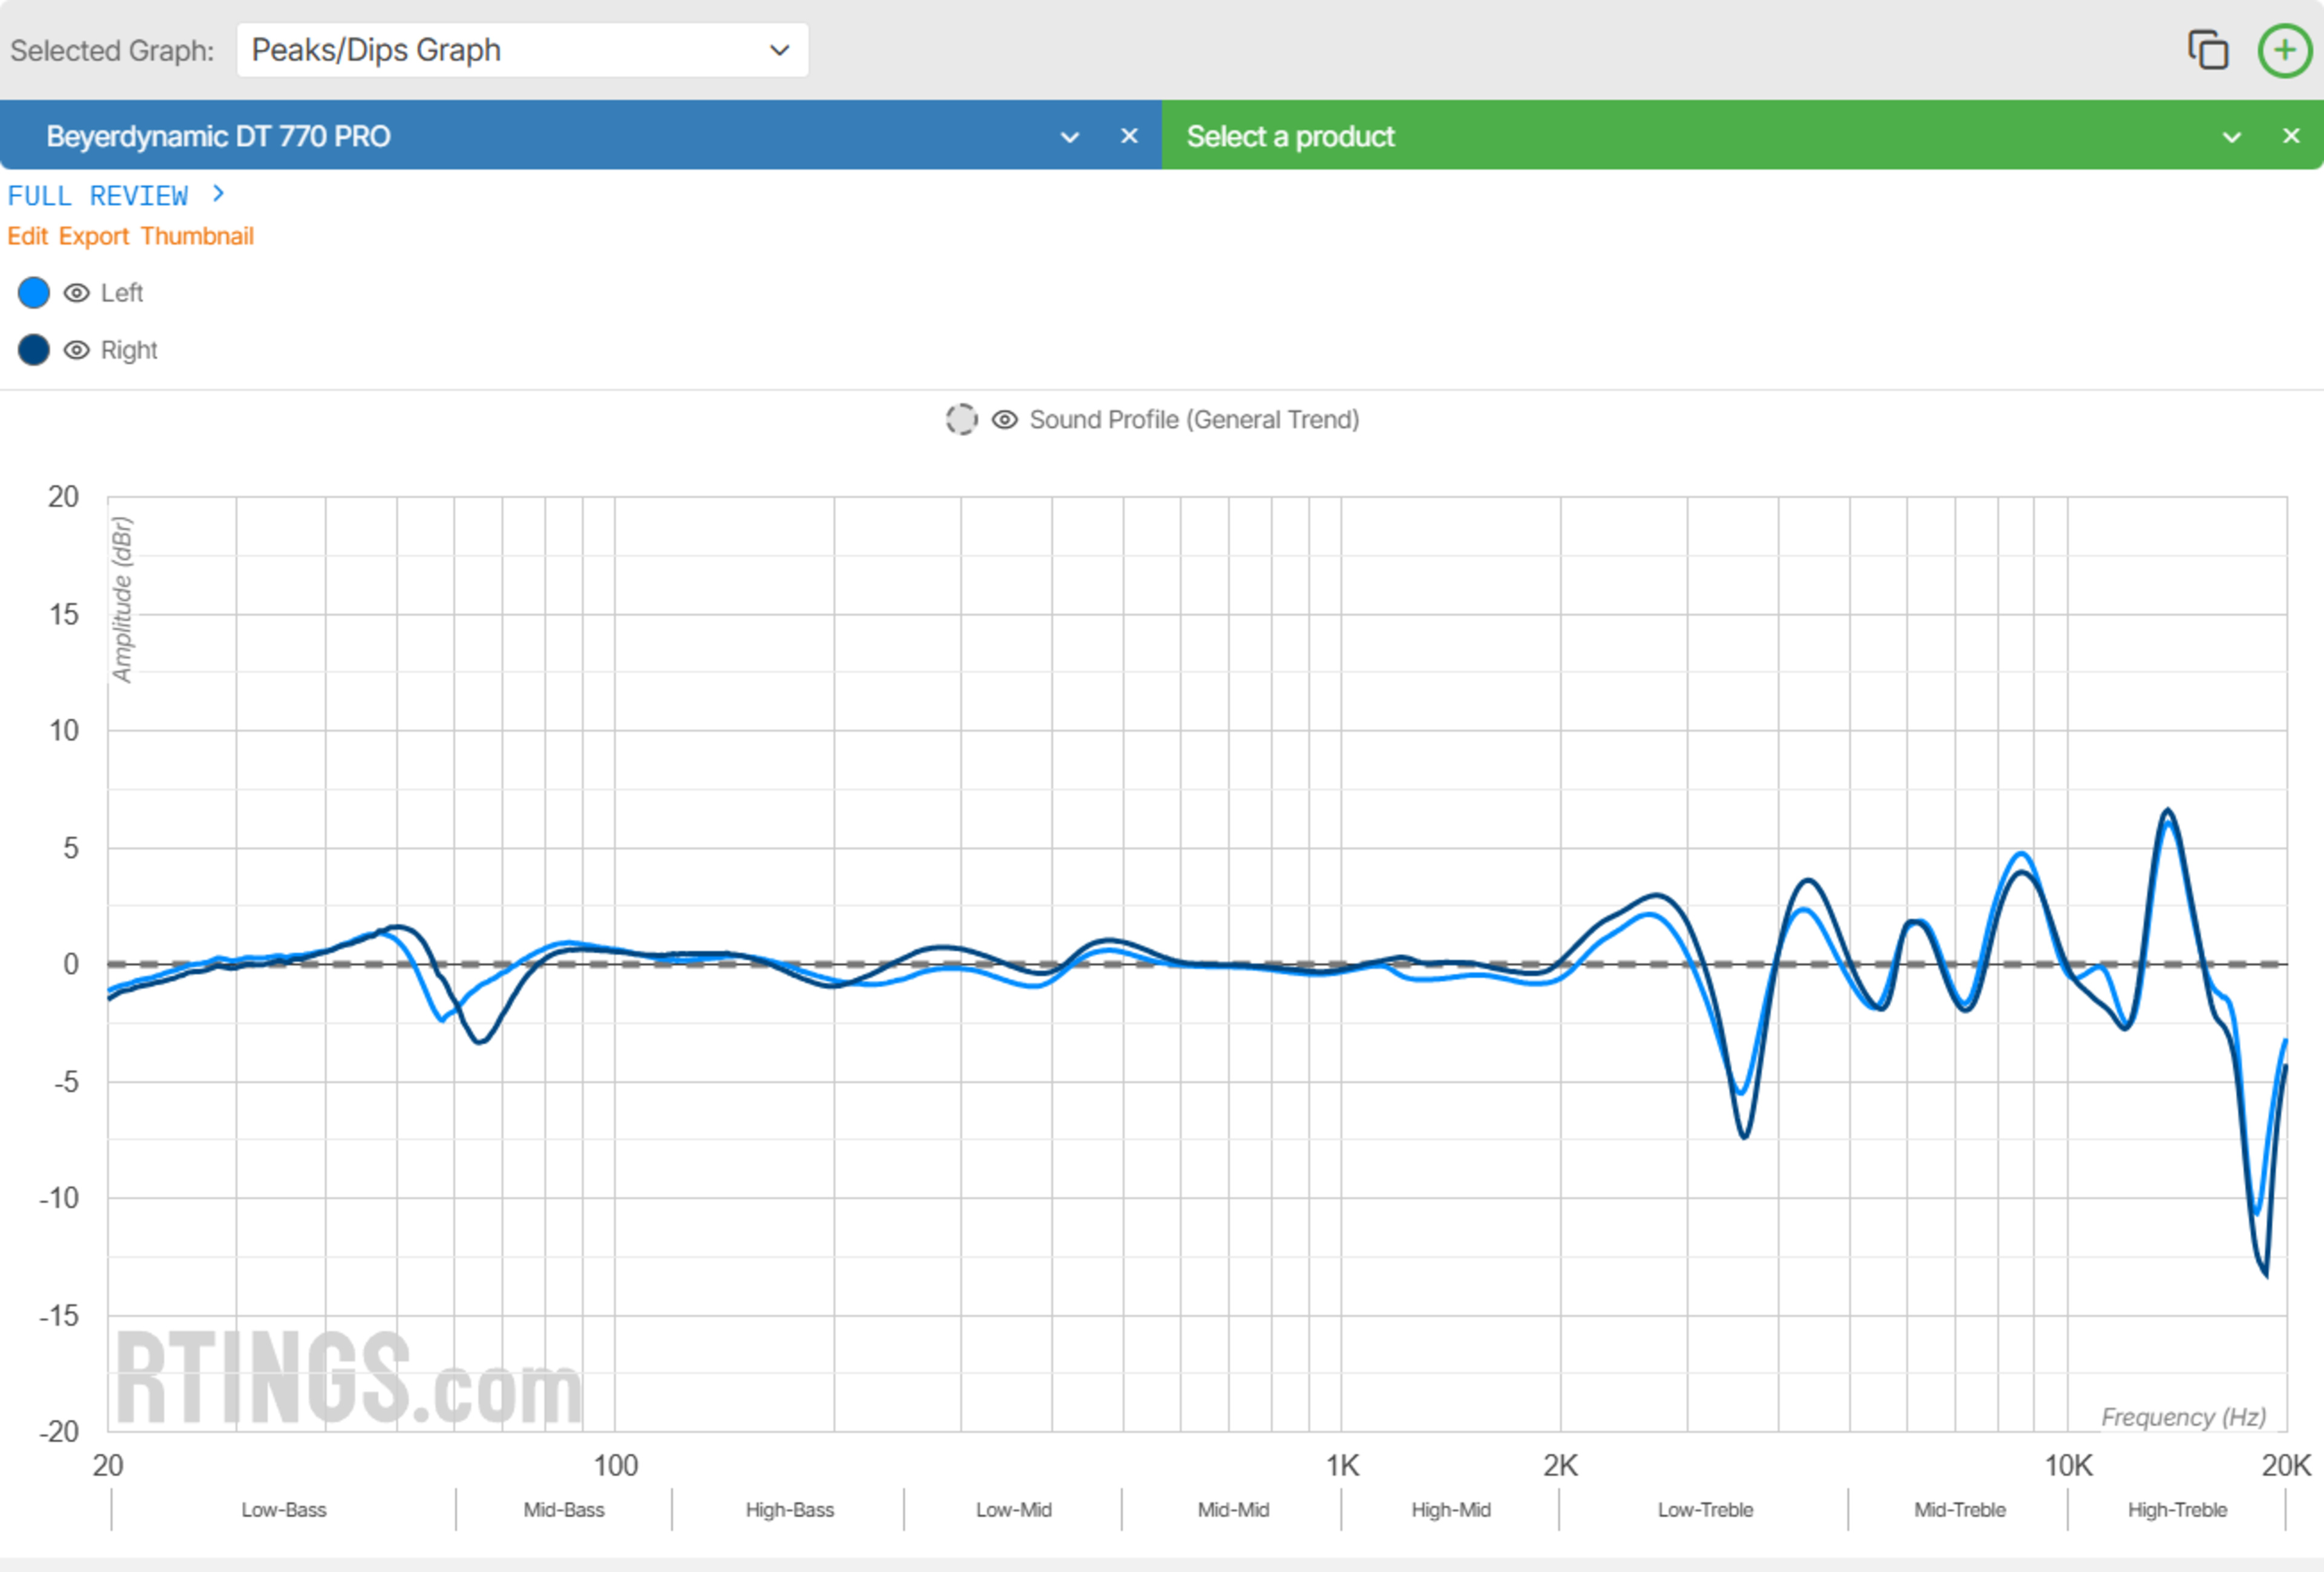
Peaks/Dips
Peaks/Dips describes how closely the headphones' frequency response resembles their own sound profile. This test assesses the headphones' frequency response relative to a more aggressively smoothed version, which helps identify groups of frequencies that are emphasized or de-emphasized relative to the headphones' own profile.
Isolated peaks and dips can cause certain notes, instruments, or vocals to stand out or get lost in the mix, while frequent deviations can highlight differences in coloration between neighboring frequency bands as content transitions between peaks and troughs in amplitude across frequencies. Though some deviations may be intentional tuning choices, our test is intention-agnostic and factors them into the overall scoring.
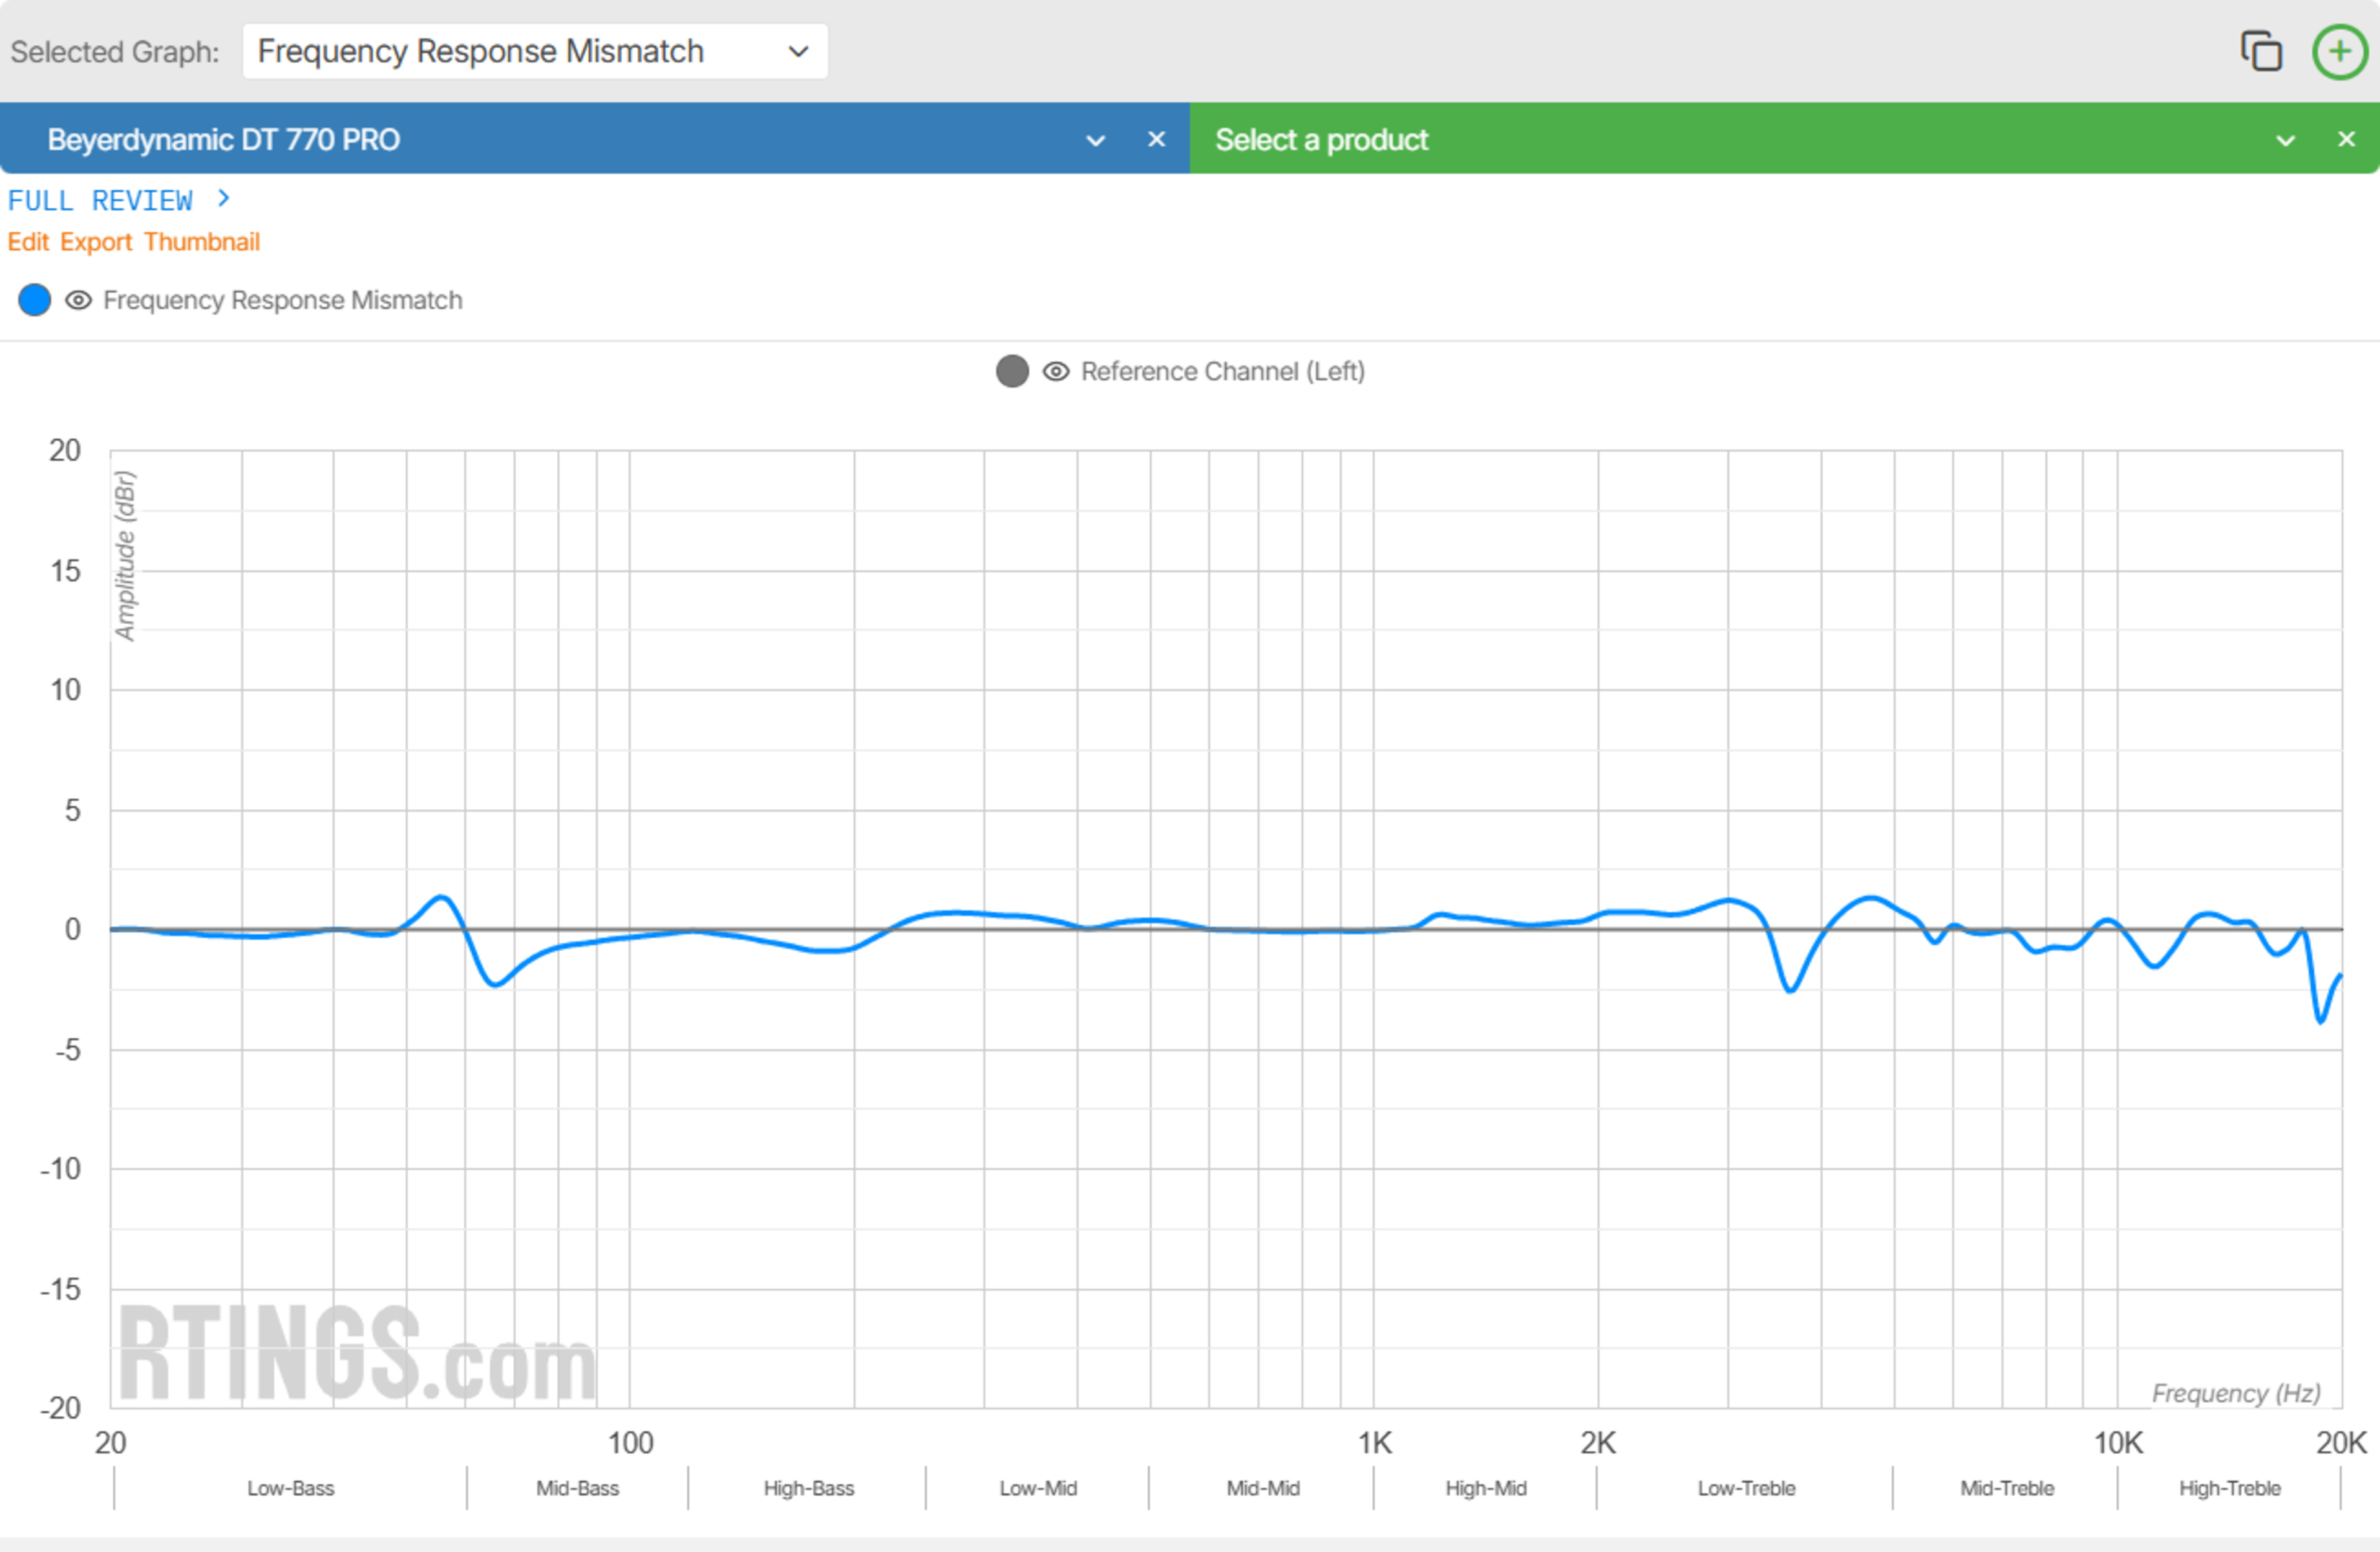
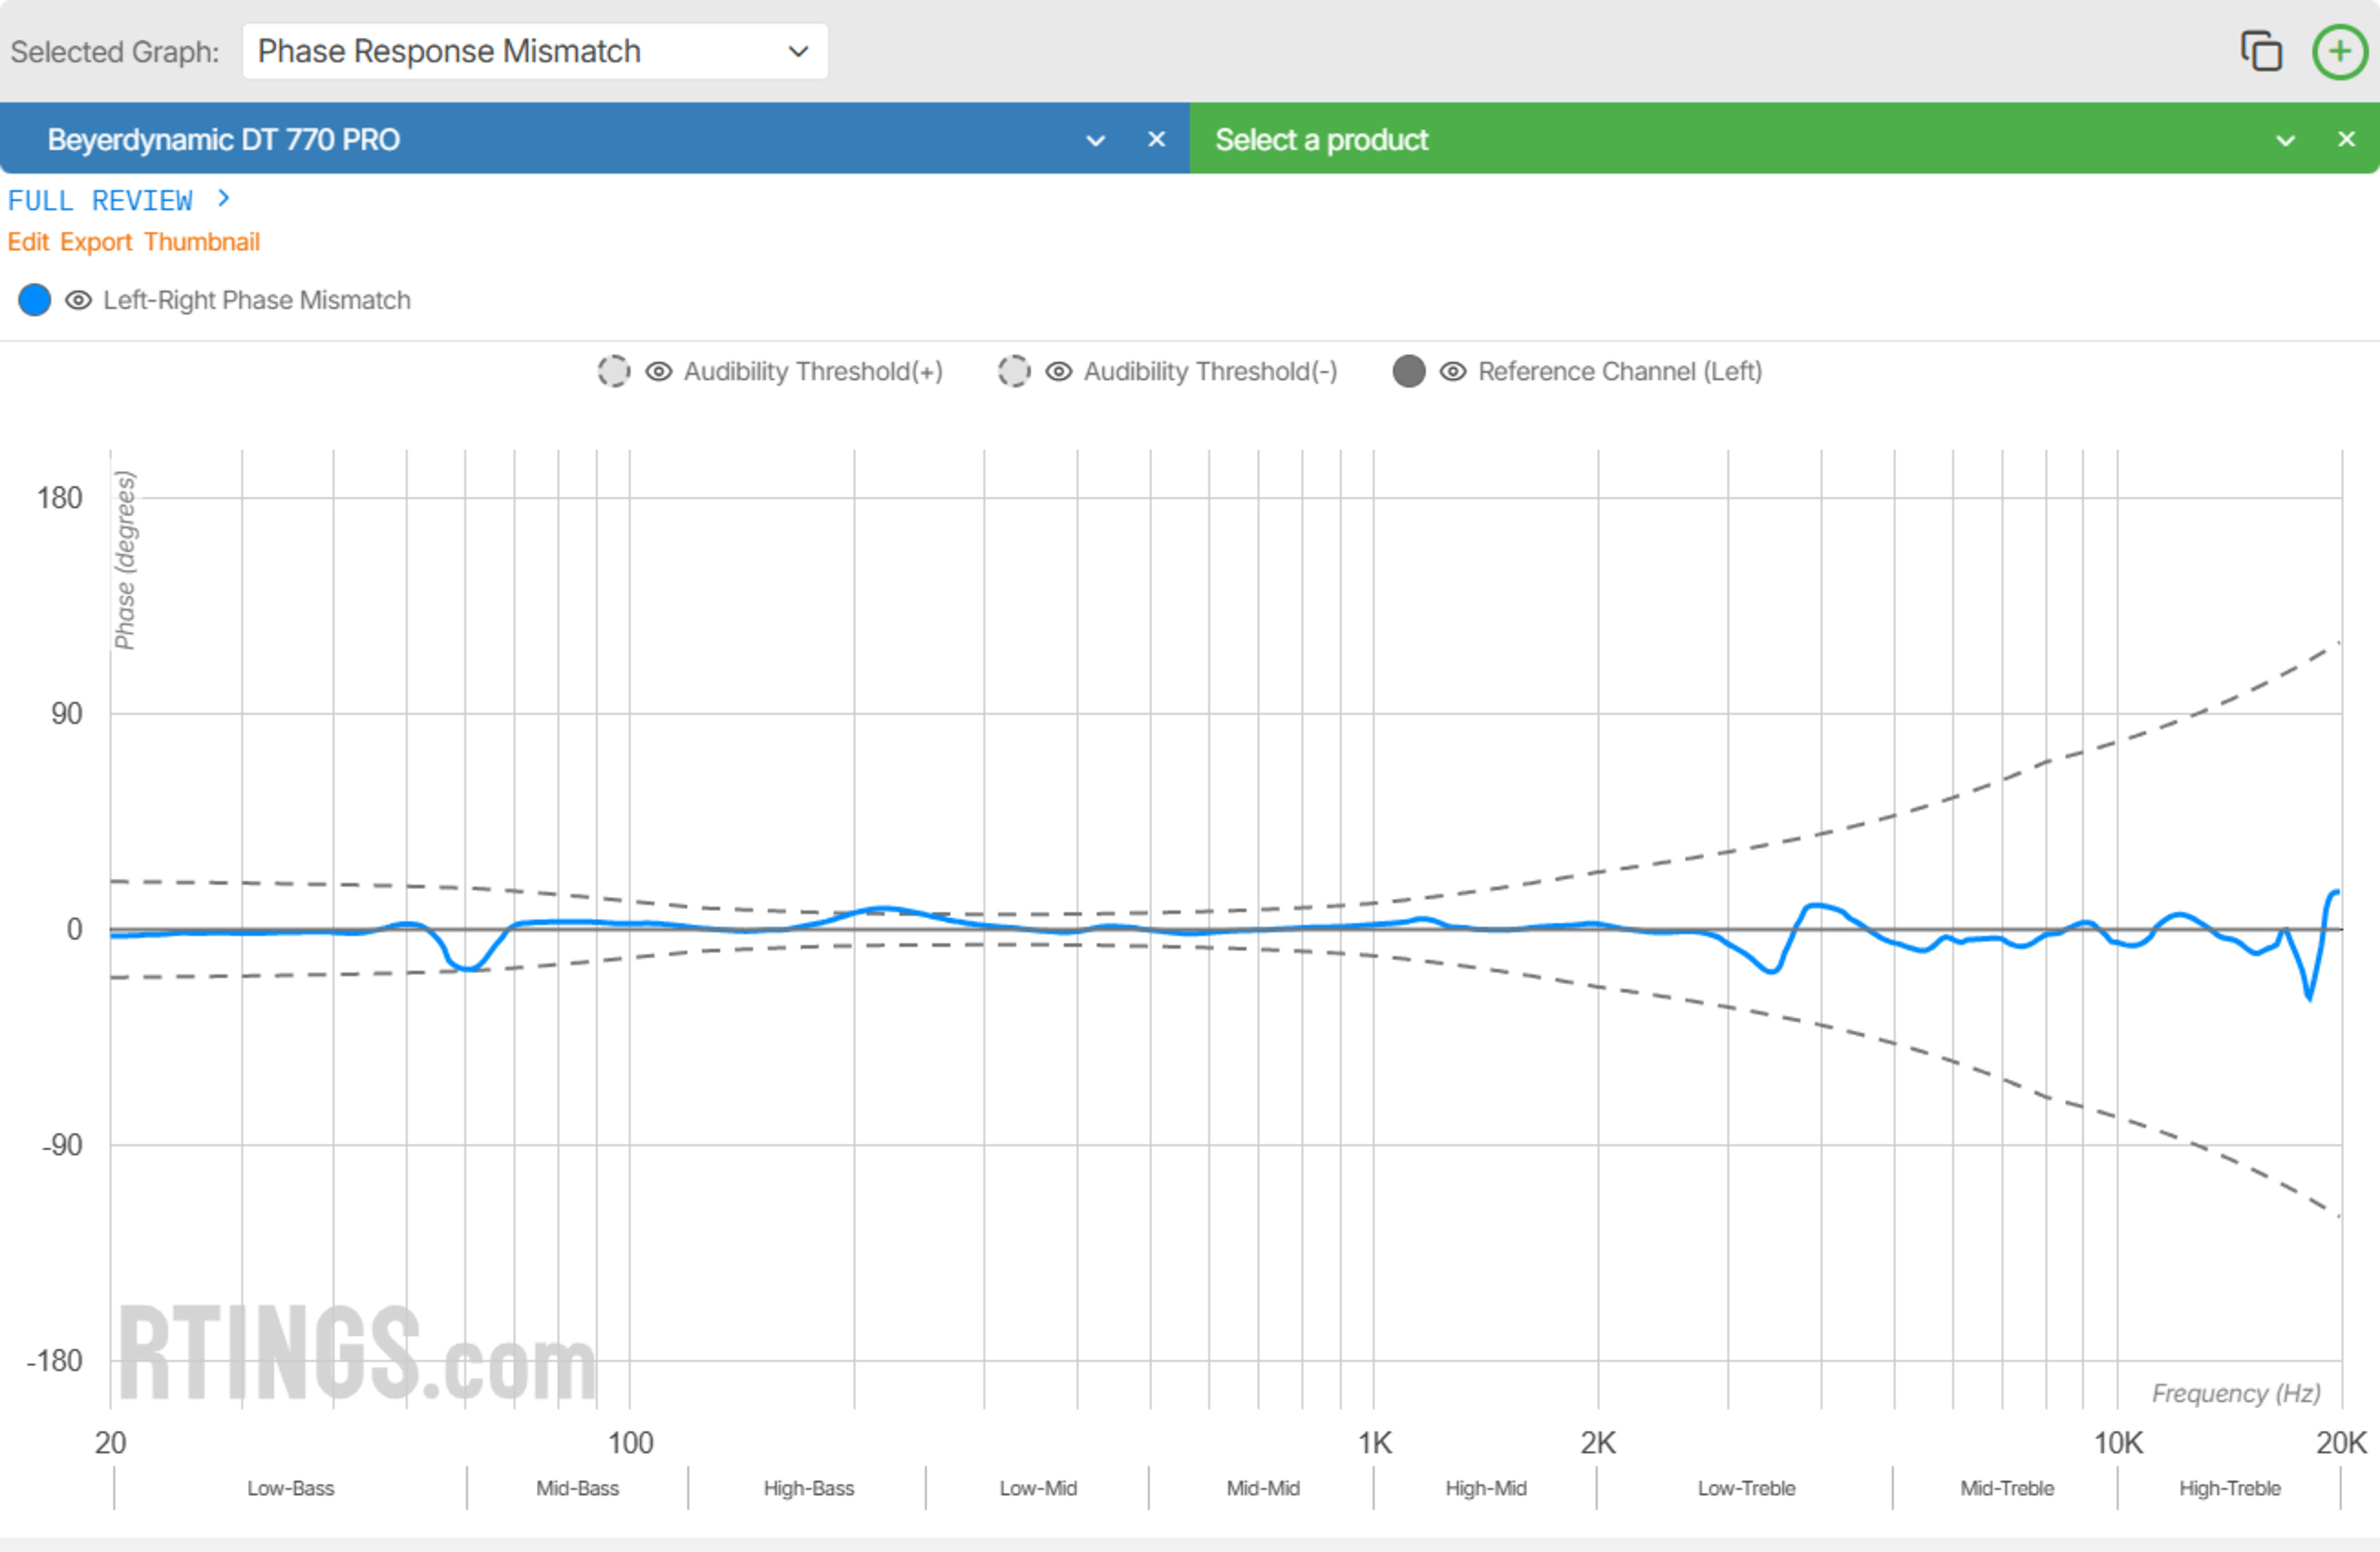
Stereo Mismatch
Stereo Mismatch measures how closely the left and right drivers of a headphone match, directly affecting how spatial cues are represented within the stereo image. Well-matched drivers produce a stable, centered image with accurate sound placement, while mismatches can cause directional drift, imbalances, or perceived gaps, leading to reduced clarity.
Our test evaluates weighted phase mismatch, which can blur or smear directional cues at affected frequencies, and weighted amplitude and frequency mismatch, where differences in loudness—either overall or within specific frequency bands—can skew the perceived location of individual sounds or shift the entire stereo image.
Unlike our Pinna-Related Transfer Function test, which describes one component of headphones' ability to create a sense of space, stereo matching reflects how accurately they reproduce spatial detail already present in the content.
 |  |
Group Delay
- 100.0% Weighted Group Delay
Group Delay measures the relative time it takes for different frequencies in a signal to travel from input to output. We treat group delay as a relative measure because uniform delays across all frequencies preserve phase relationships and do not alter the signal's shape. However, when group delay varies with frequency, it can affect the perceived tightness or clarity of transients, like kicks or snares, by smearing the timing of individual frequency components. These timing differences also create unequal phase shifts between neighboring frequencies, which can lead to peaks and dips in the frequency response due to constructive and destructive interference.
 | |
Cumulative Spectral Decay
Cumulative Spectral Decay (CSD) plots visualize how sound from a headphone driver decays over time, revealing potential resonances that persist after the signal stops. Unlike standard frequency response graphs, which show amplitude versus frequency, CSD adds a time axis to show how different frequencies settle or ring. While this can highlight resonances that color the sound, interpreting CSD meaningfully requires experience. In headphone testing, especially, results can be misleading: in the tightly coupled space between the driver and the ear, apparent decay is often an artifact of analysis settings, like windowing, rather than true acoustic behavior. For this reason, CSD is best used by readers familiar with both its utility and its limitations.

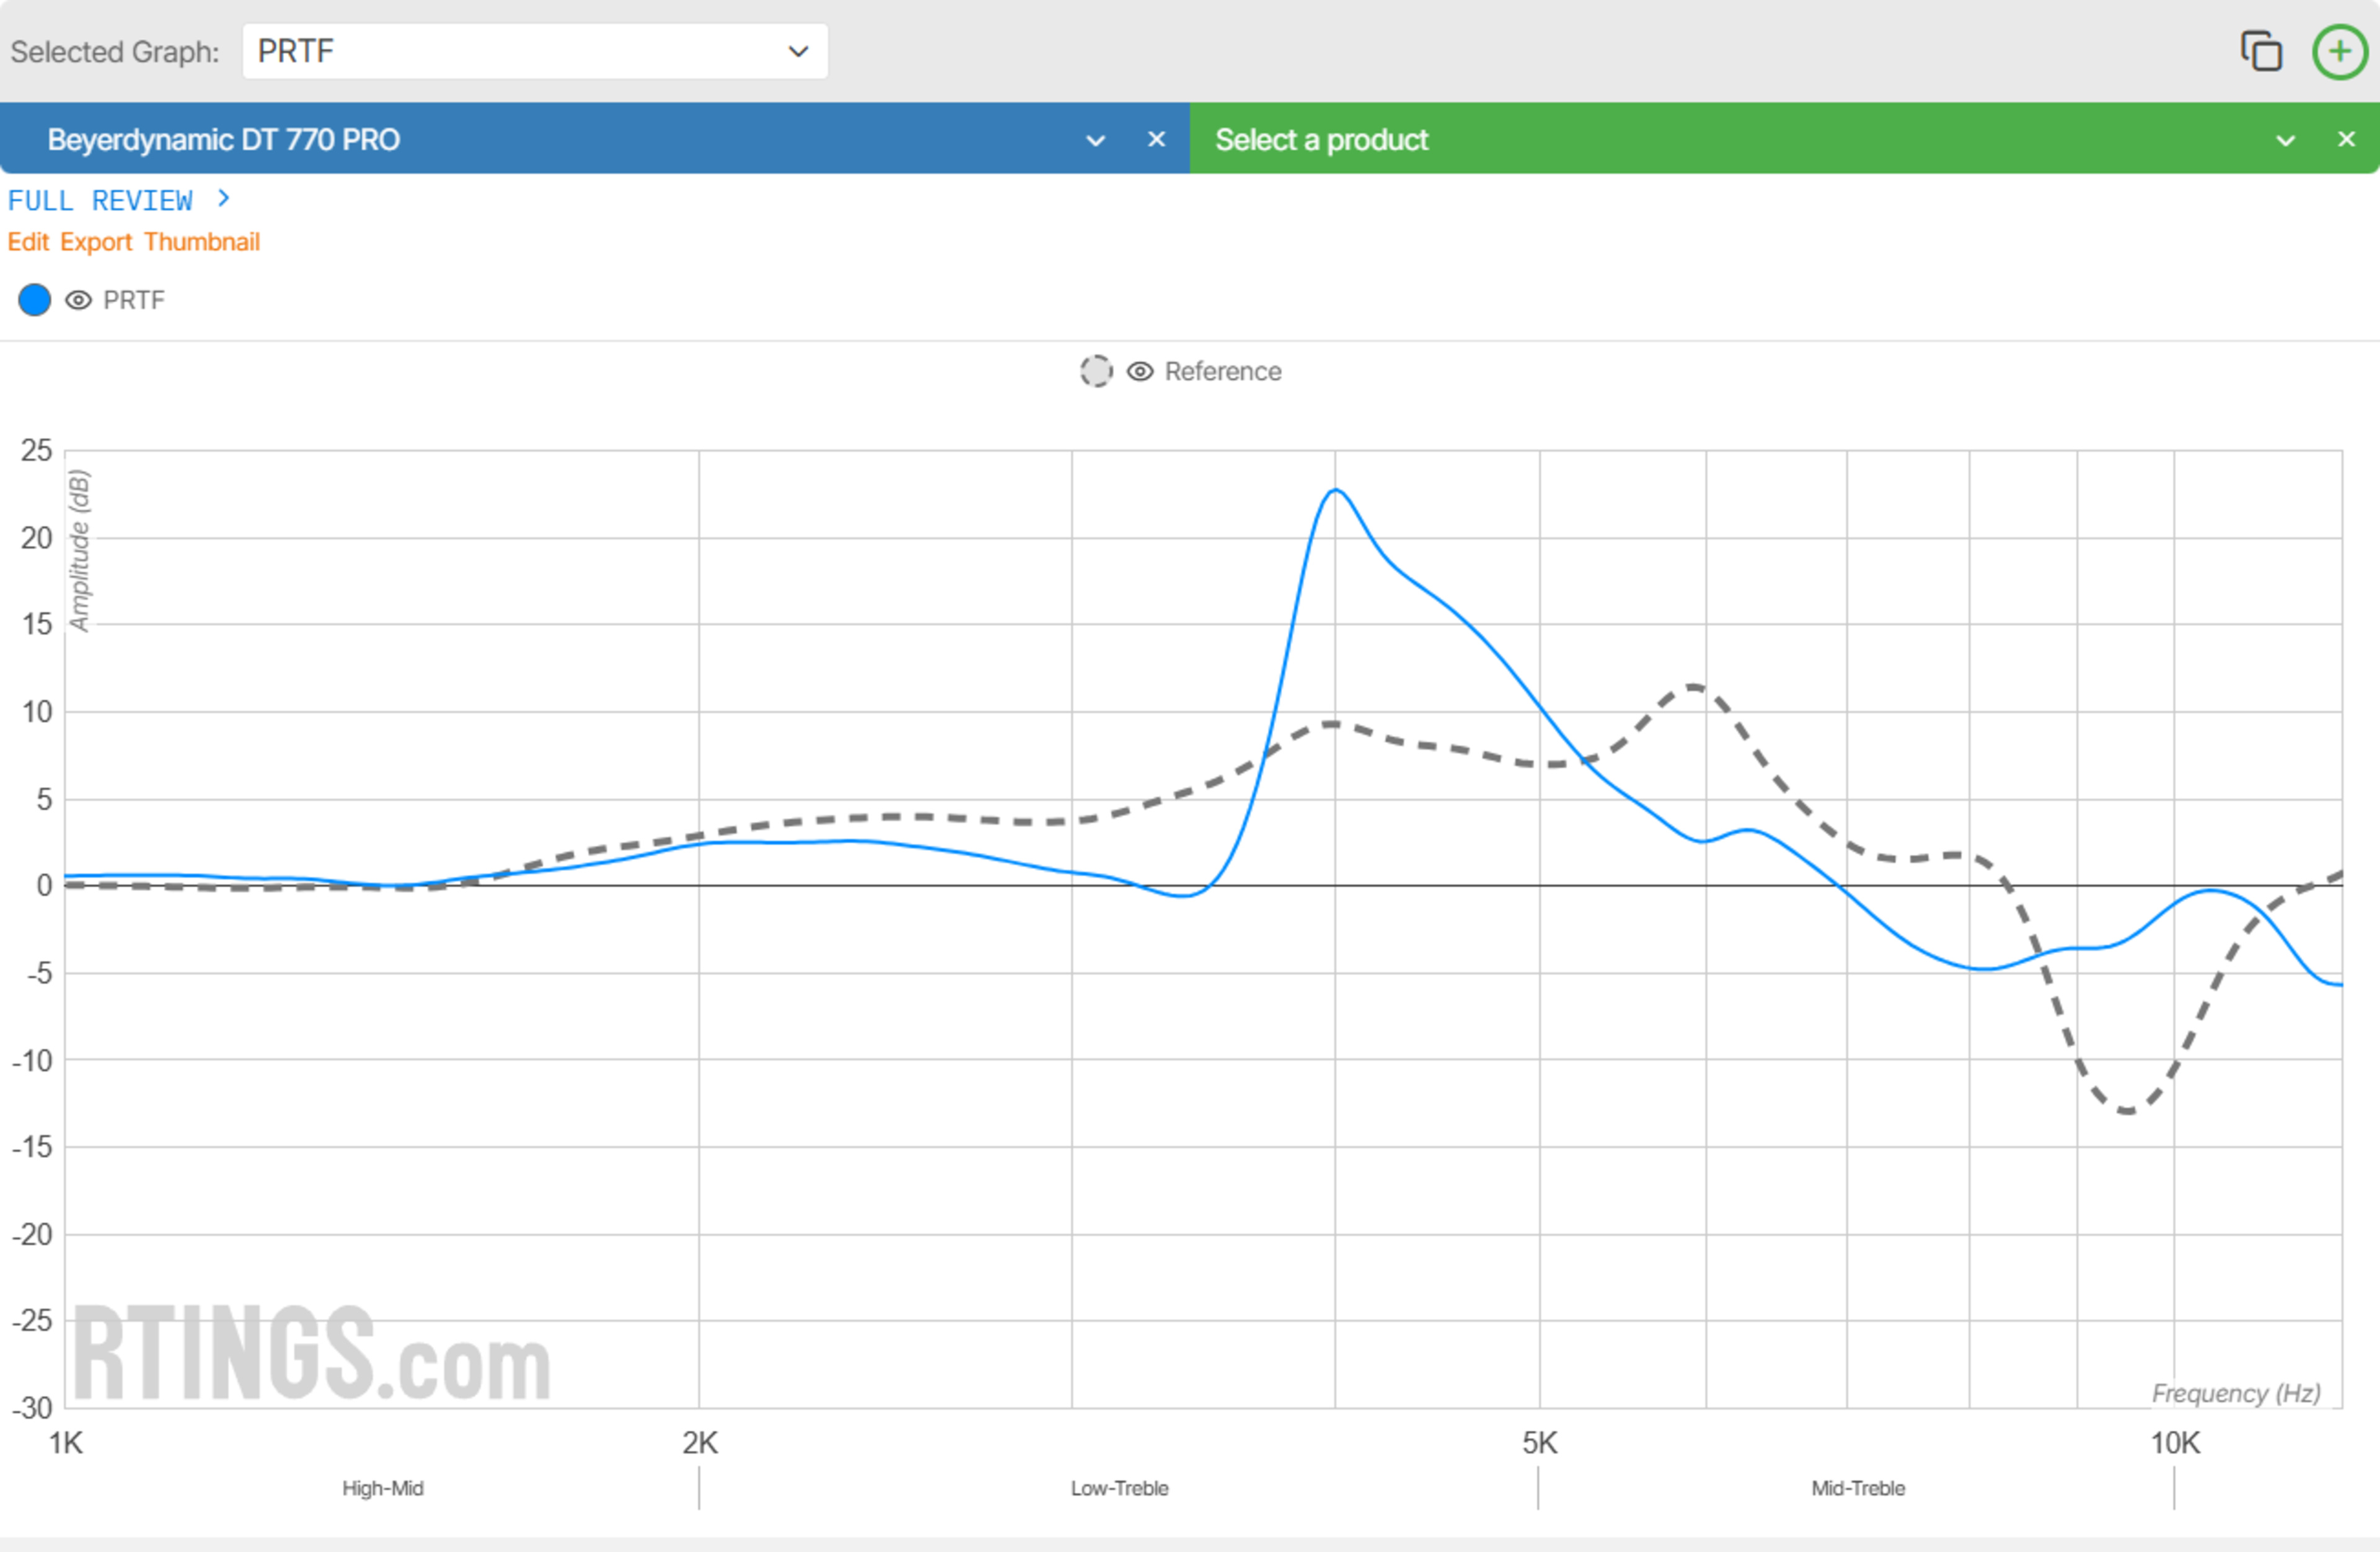
Pinna-Related Transfer Function
- 15.0% PRTF Accuracy (RMS Deviation)
- 15.0% PRTF Size (Avg.)
- 35.0% PRTF Distance
Pinna-Related Transfer Function (PRTF) measurements demonstrate how headphones interact with the outer ear to shape directional and spatial cues. Our benchmark for this test is a stereo setup with angled speakers. To produce the PRTF, we measure the difference in frequency response captured by our HMS II.3 HATS with and without the pinna in place. Comparing the headphones' transfer function to that of the speaker system provides partial insight into its ability to reproduce the spatial characteristics of our benchmark. While strong PRTF performance doesn't guarantee a wide or natural soundstage, it can contribute to a more immersive listening experience. Since in-ear monitors (IEMs) bypass the pinnae entirely, this test does not apply to them.
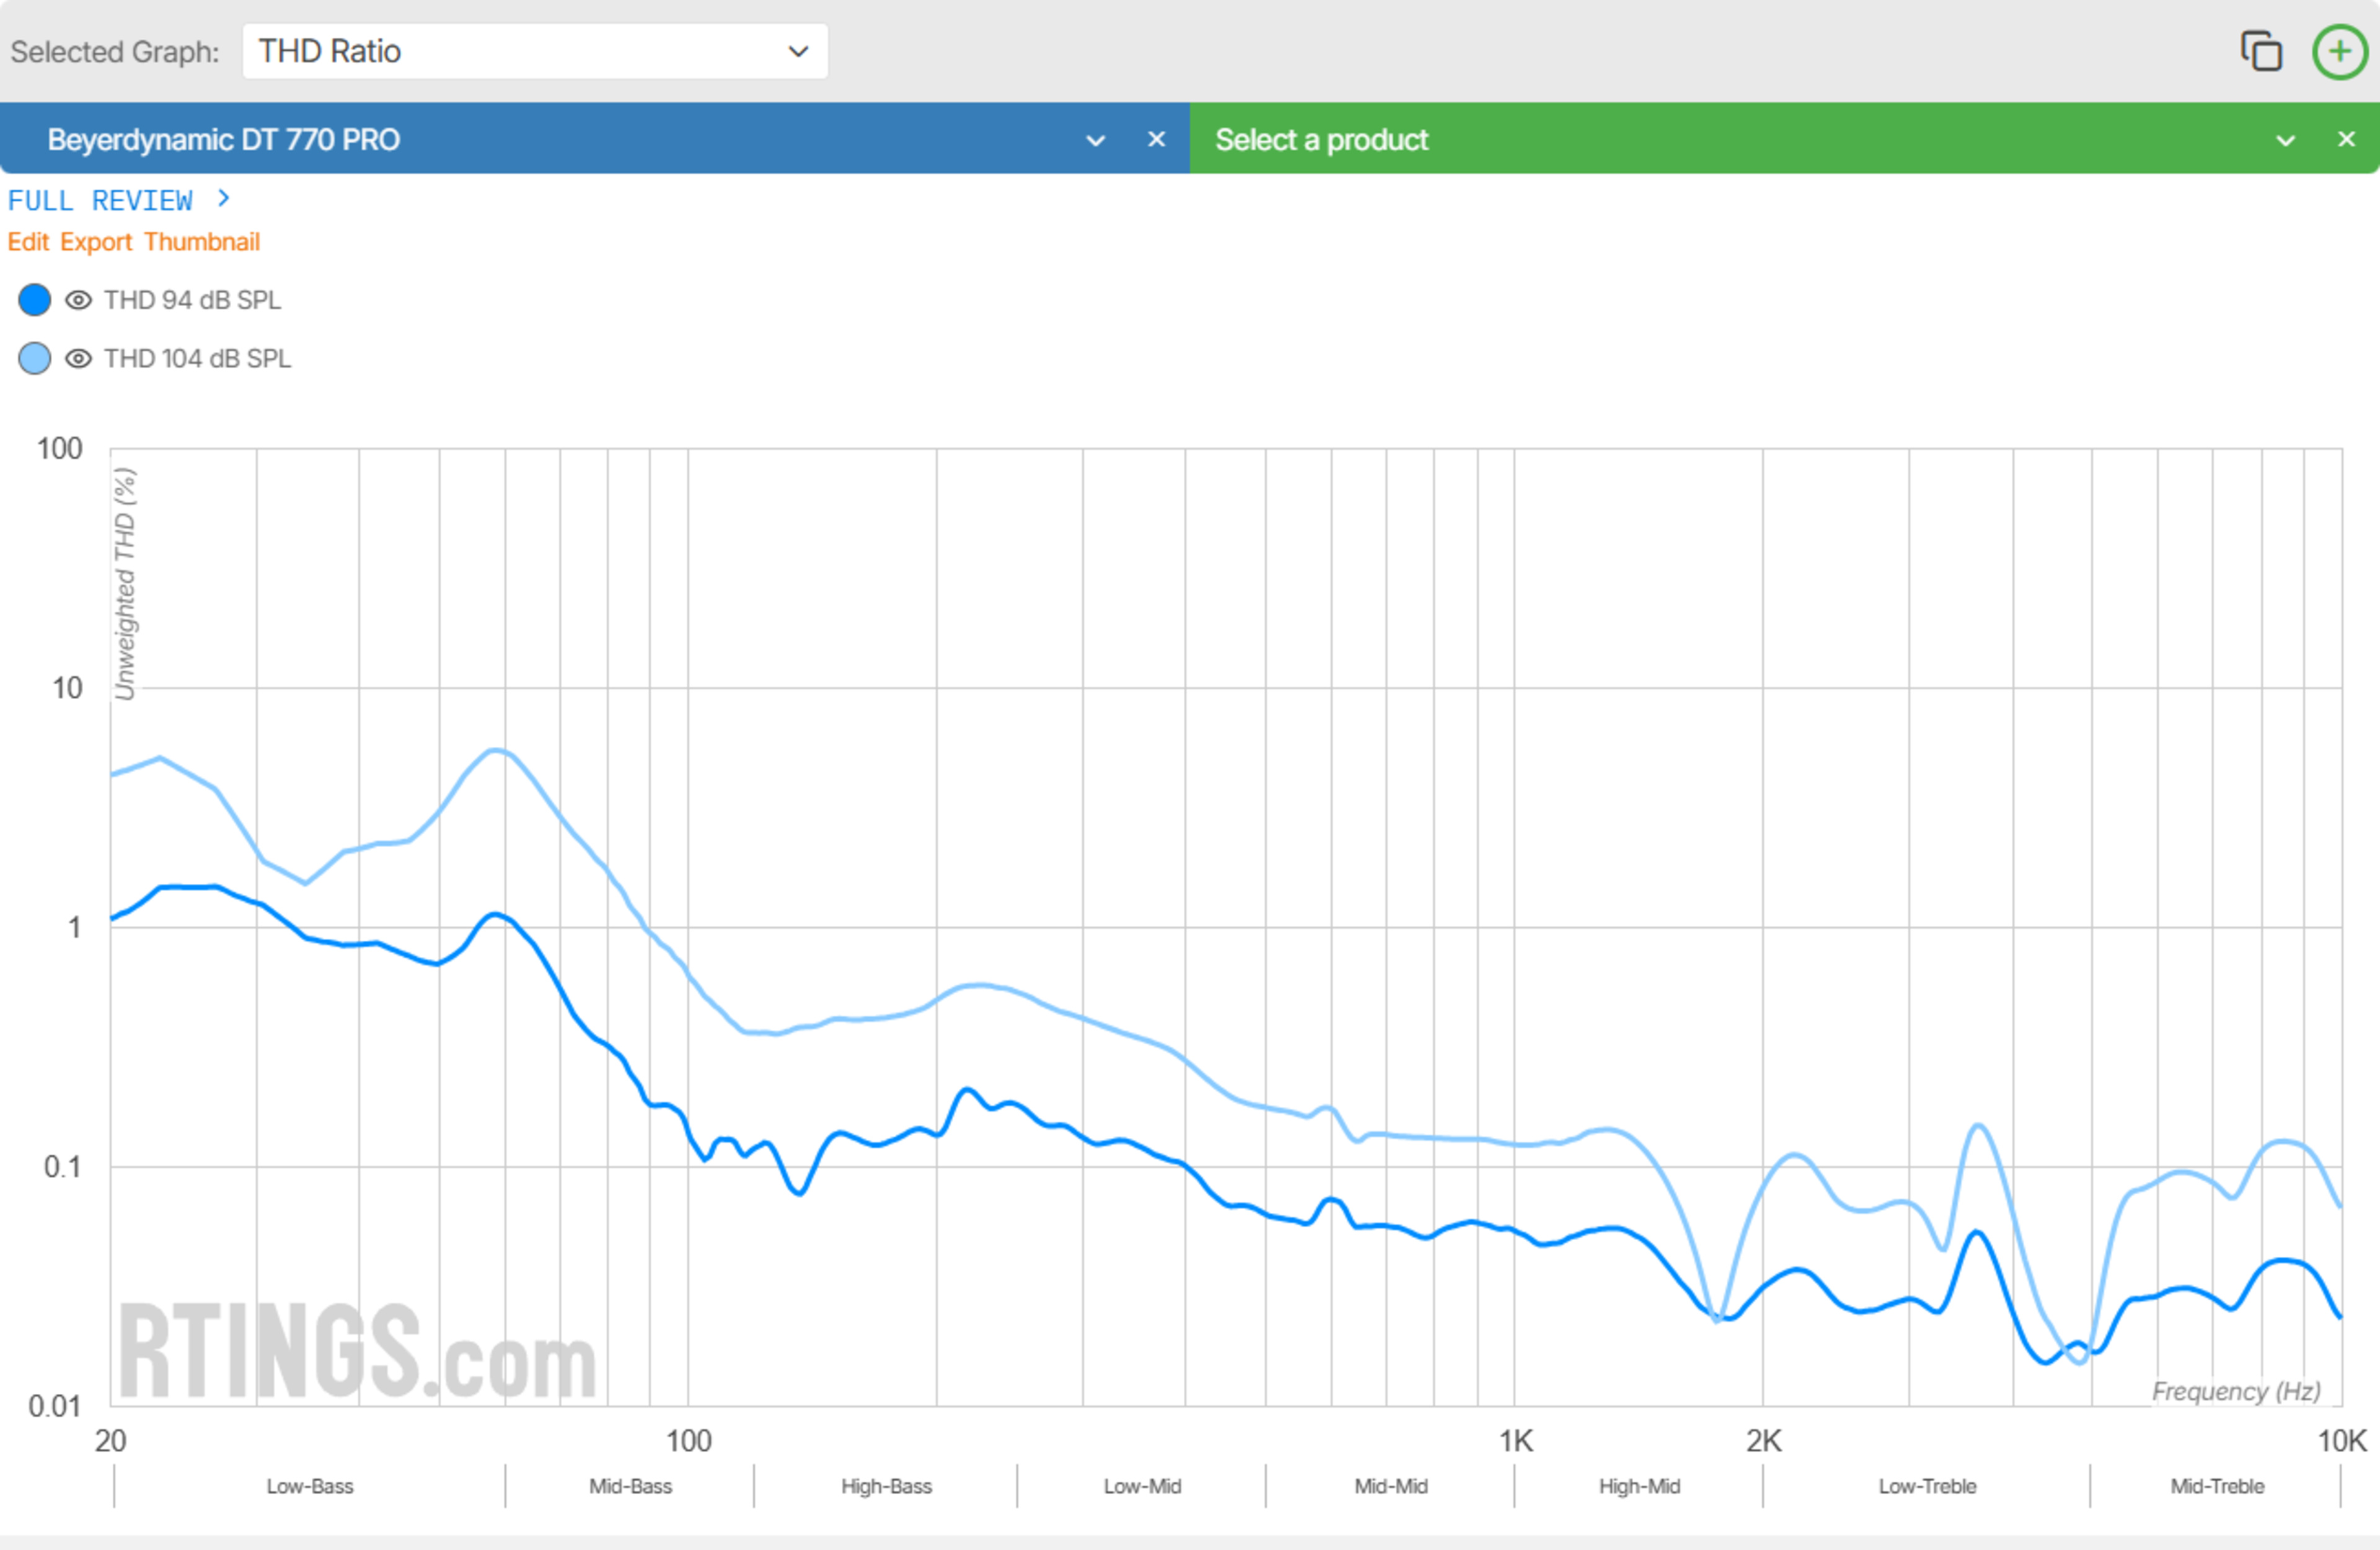
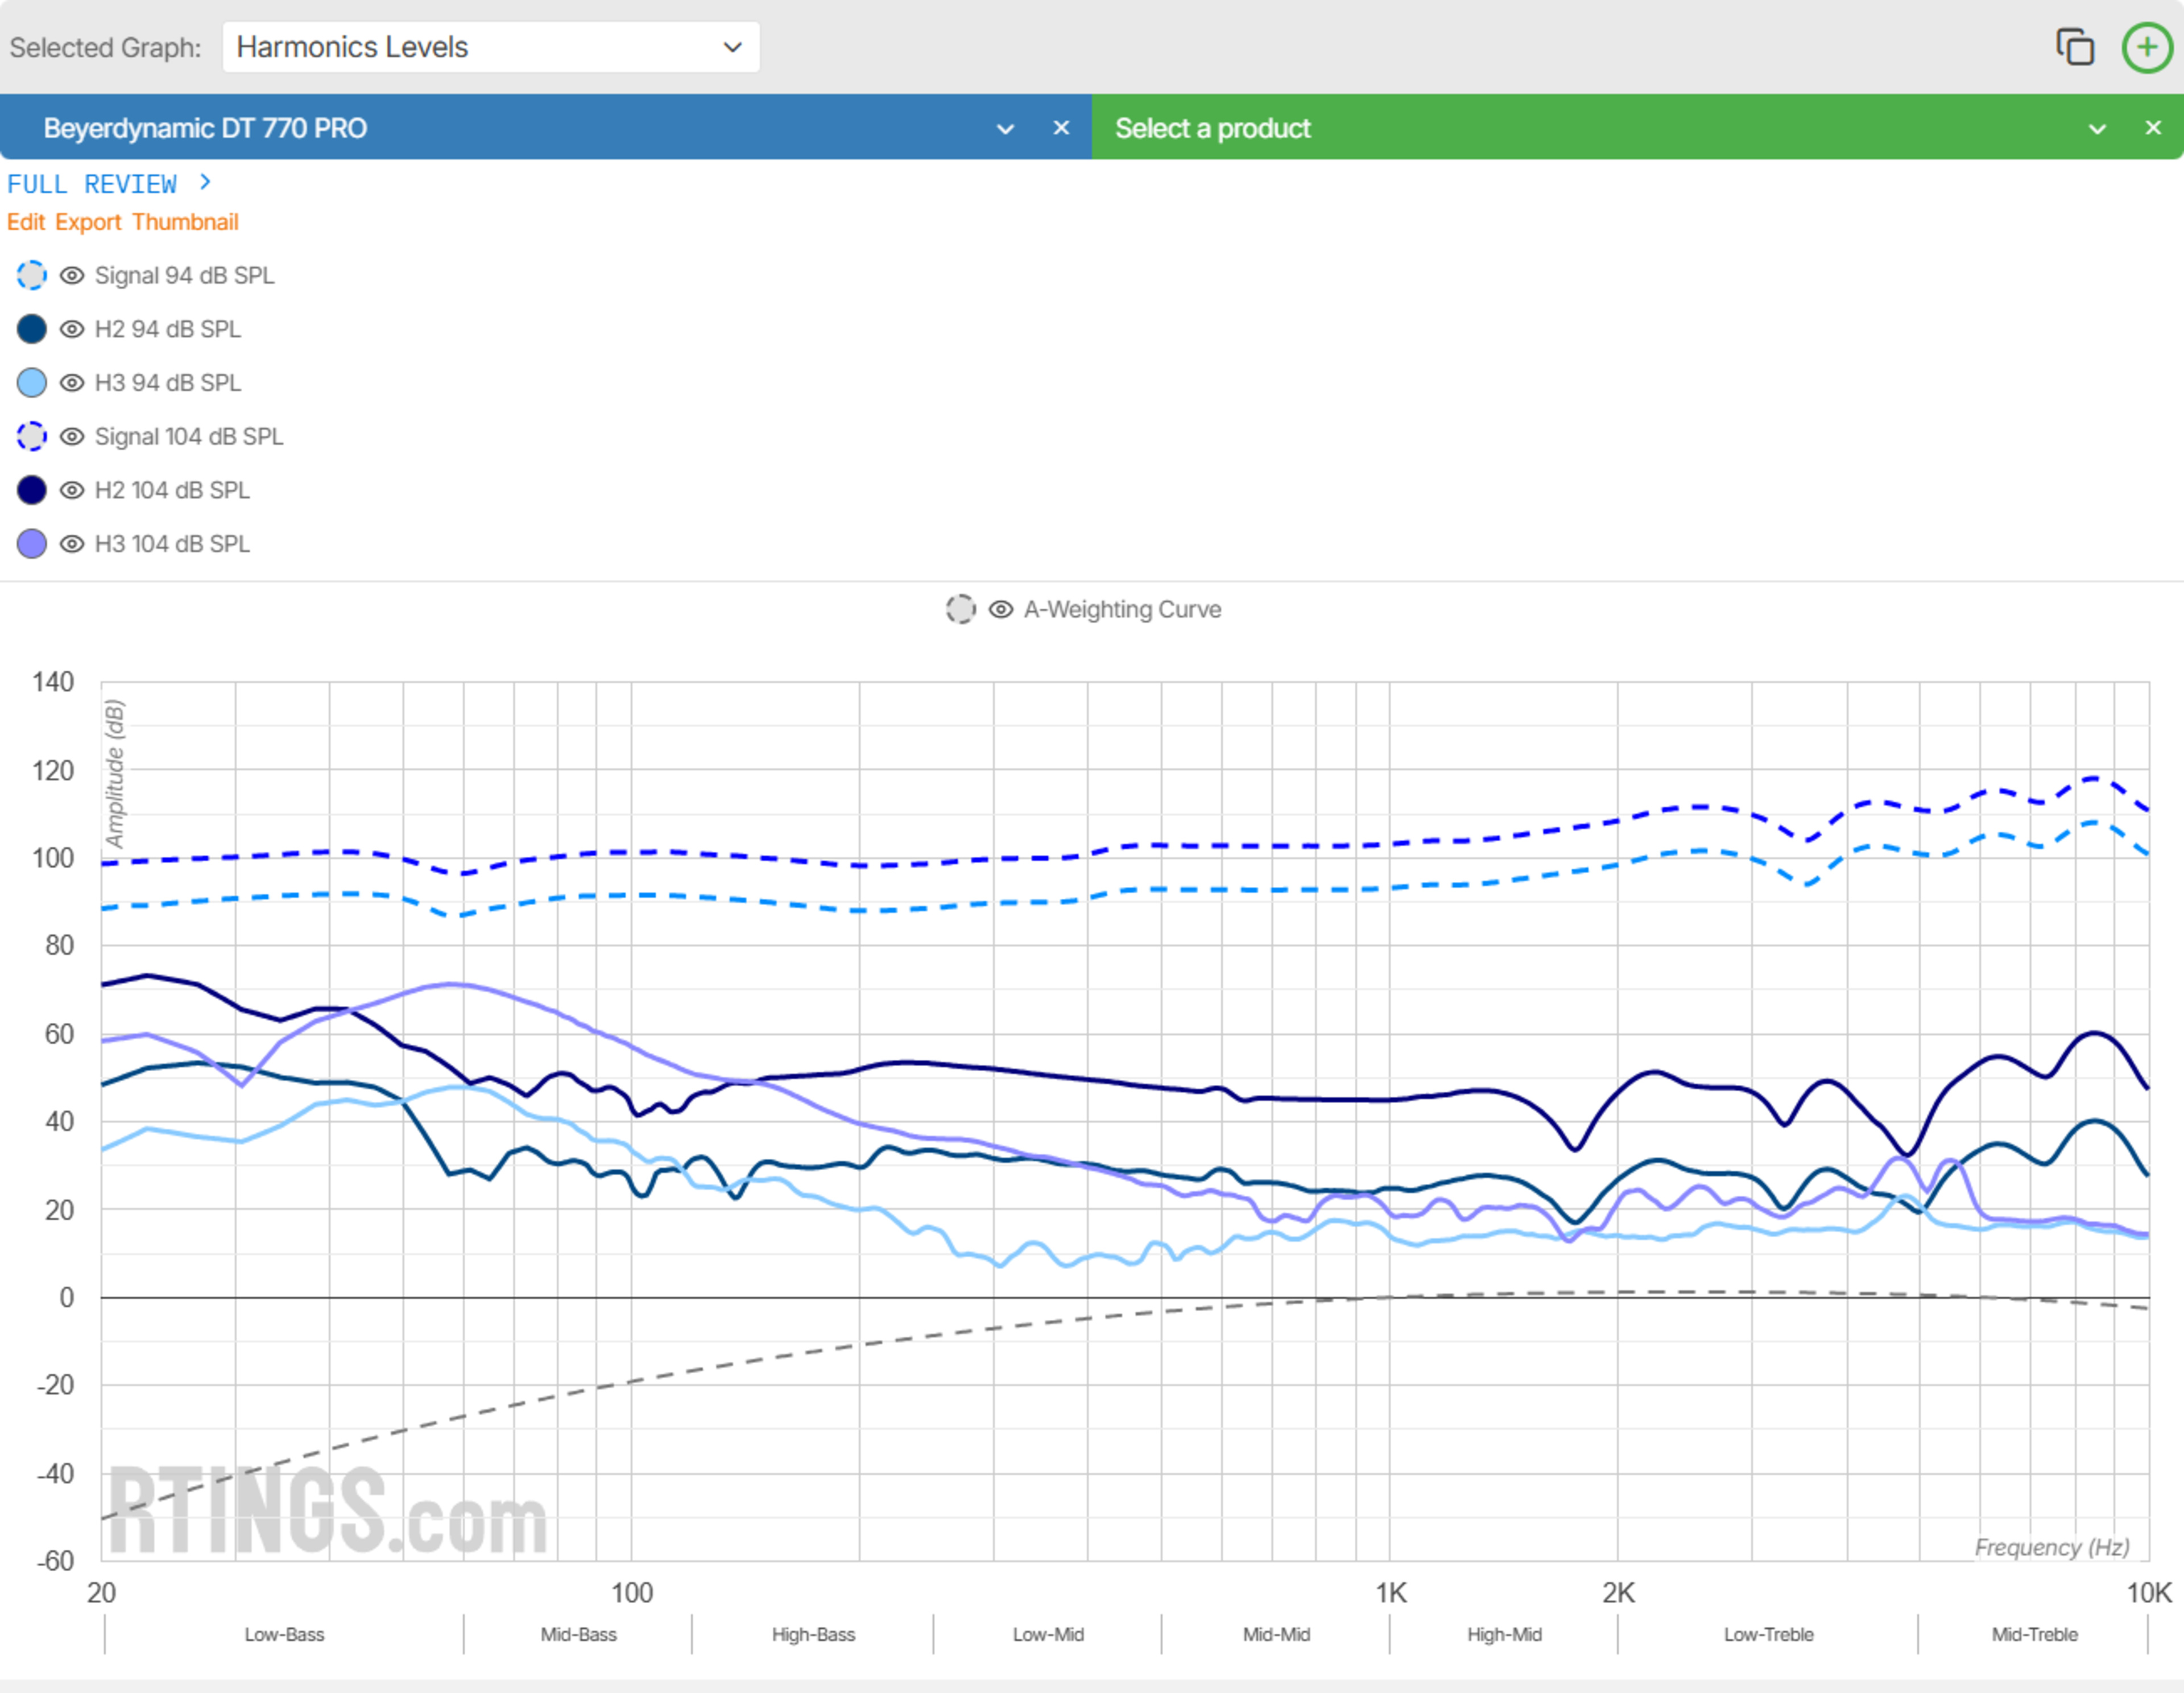
Harmonic Distortion
- 50.0% WHD @ 94 dB SPL
- 50.0% WHD @ 104 dB SPL
Harmonic Distortion measures unwanted frequencies introduced during playback that weren't present in the original audio. Unlike noise, which is unrelated to the source, harmonic distortion is signal-dependent and generally undesirable, as it can color headphones' sound and introduce harshness or muddiness.
Most well-designed headphones keep distortion low enough to remain inaudible to typical listeners and unlikely to affect everyday use. We take measurements at 94 dB SPL and 104 dB SPL, then calculate A-weighted harmonic distortion (WHD) at each level. While these calculations reflect some aspects of human hearing, they don't account for other factors, such as age-related sensitivity loss at higher frequencies.
 |  |
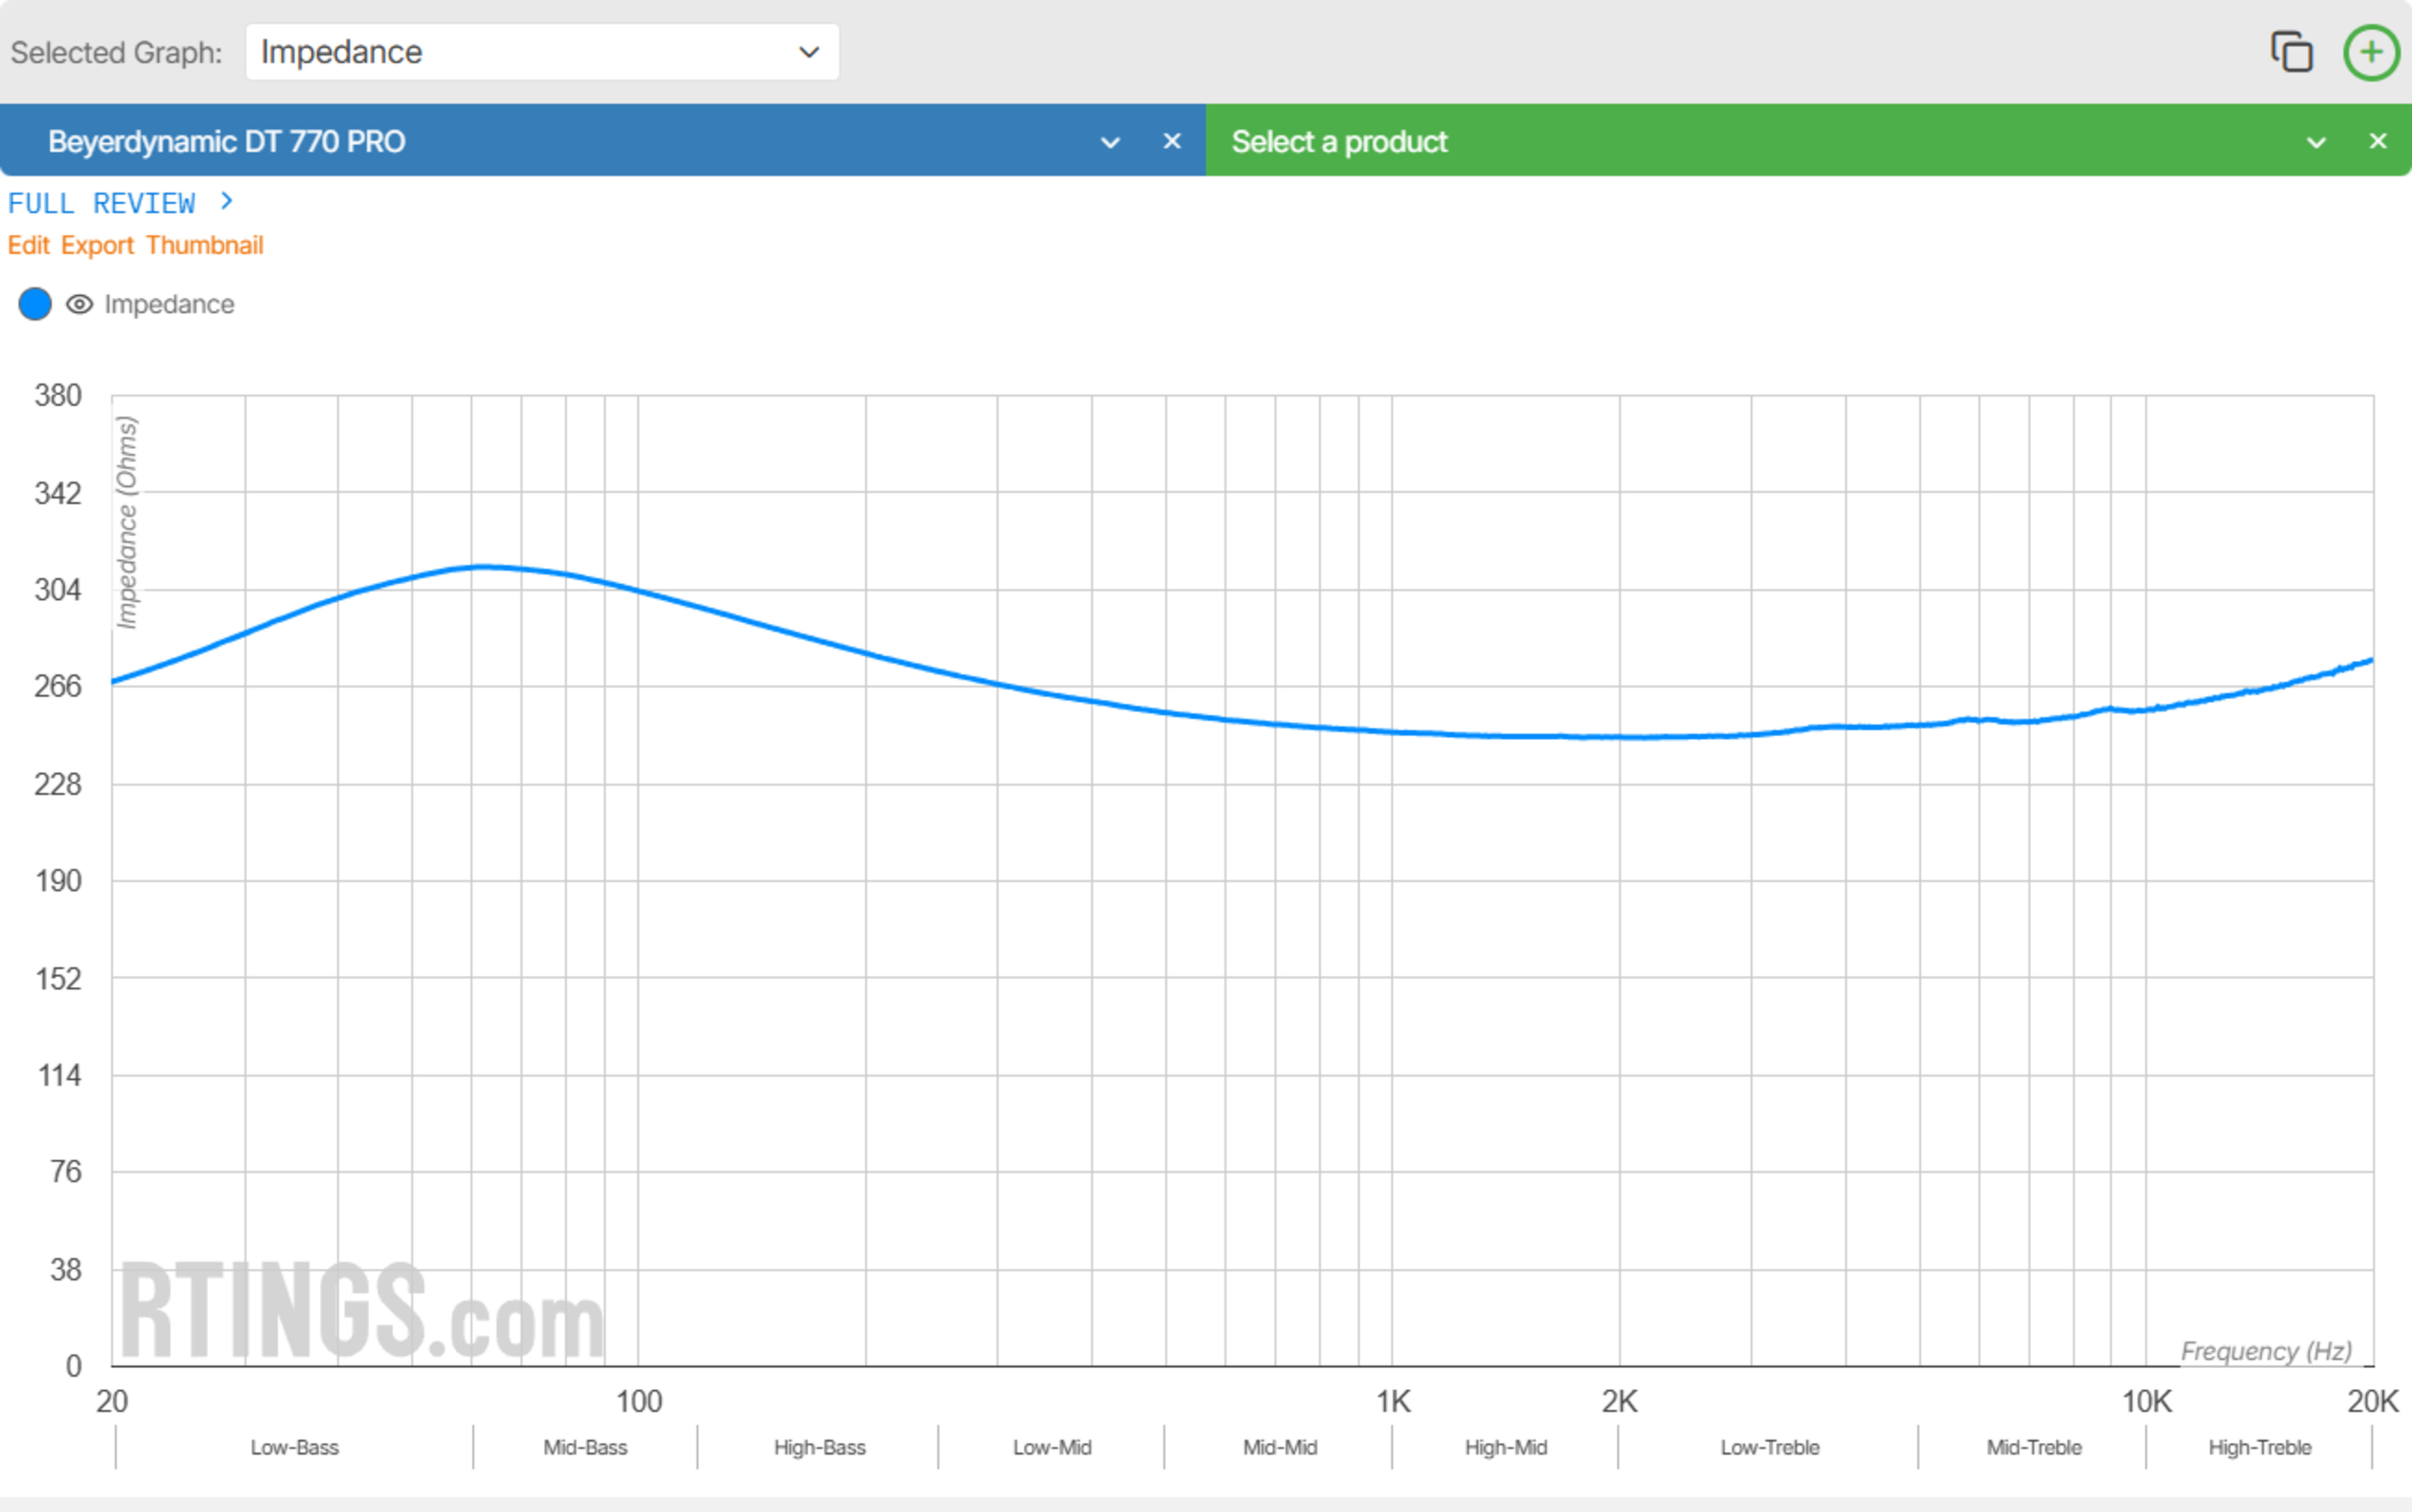
Electrical Aspects
Electrical aspects describe the electro-acoustic properties of headphones. For analog headphones, we measure impedance across the audible frequency spectrum and sensitivity at 1kHz using industry-standard signals. For Bluetooth headphones, we report maximum SPL at full volume. If they also support passive use, we measure impedance and sensitivity with power off. These measurements help determine whether external amplification is needed to power headphones.
Conclusion
To understand a pair of headphones' sound, we evaluate both performance-based and preference-based tests to give you a better picture of what you can expect with your own product. In the case of preference-based tests like sound profile and frequency response, there are no scores. Enjoying a sound other than our target curve is possible, and that's alright! While we do score headphones' compliance with our target, you can use the data to make your own informed decision if you prefer a different sound. Beyond this, other tests like peaks/dips and harmonic distortion are performance-based. For example, if there's a lot of distortion, all users will find this bad. We score performance in these tests, and they account for a meaningful portion of headphones' final ratings.
Recent Updates
- 06-09-2025: We updated this article to align with changes made as part of Headphones Test Bench 2.0. This includes the addition of new sections for Stereo Mismatch, Group Delay, CSD, and Electrical Aspects.